
Figure 2.
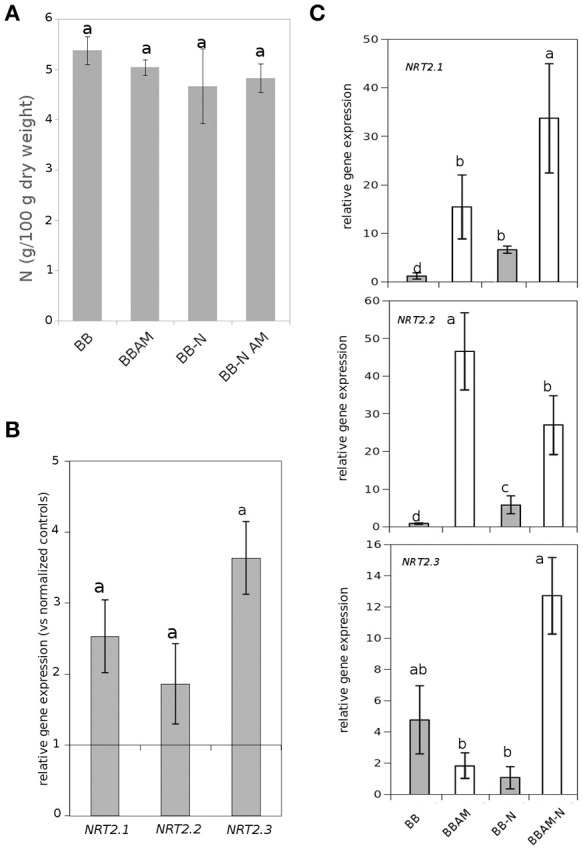
Effect of N starvation on total N shoot levels and nitrate transporter gene expression. (A) The nutritional status measured as N leaf content in non-infected plants and (B) the induction of nitrate transporters gene expression in leaves of non-mycorrhizal plants upon N starvation. Data are standardized with normally fertilized control plants. (C) Gene expression of nitrogen transporters in leaves of either non-mycorrhizal or mycorrhizal infected tomato plants at 72 hpi (BB, BBAM) normally fertilized or upon 48 h of nitrogen depletion (−N). Different letters indicate statistically significant differences (ANOVA, Fisher's Least Significant Difference (LSD) test; P < 0.05, n = 6).