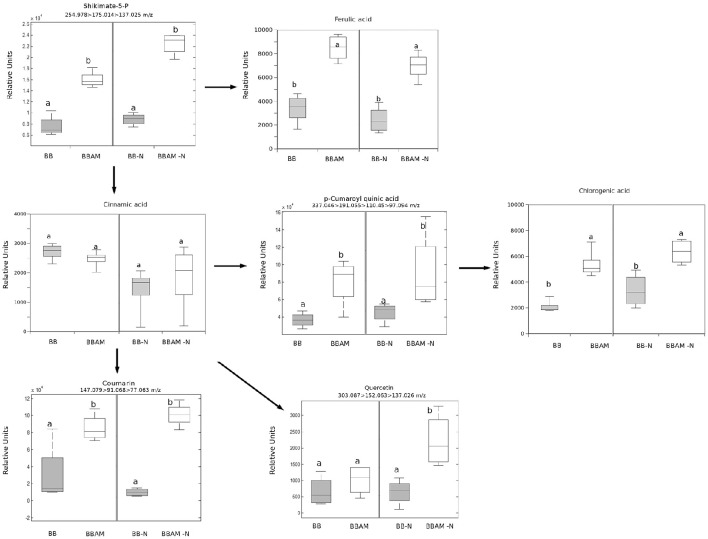
Figure 8.
Profile of phenolic acid and their derivatives upon B. cinerea infection in non-mycorrhizal and mycorrhizal plants either normally fertilized or under a transient N depletion. Signal identity was confirmed by using chemical standards for chlorogenic acid and ferulic acid, and fragmentation spectra were used to identify the other phenols (see Table S2). Non-mycorrhizal infected tomato plants (BB) and mycorrhizal infected tomato plants (BBAM); (−N) plants exposed to 48 h of nitrogen depletion and fungal inoculation at 72 hpi. Leaf material from 3 individual plants was pooled for each treatment combination. Box plots represent the means for three independent experiments with two technical replicates. Different letters indicate statistically significant differences (ANOVA, Fisher's Least Significant Differences (LSD) test; P < 0.05, n = 6).

