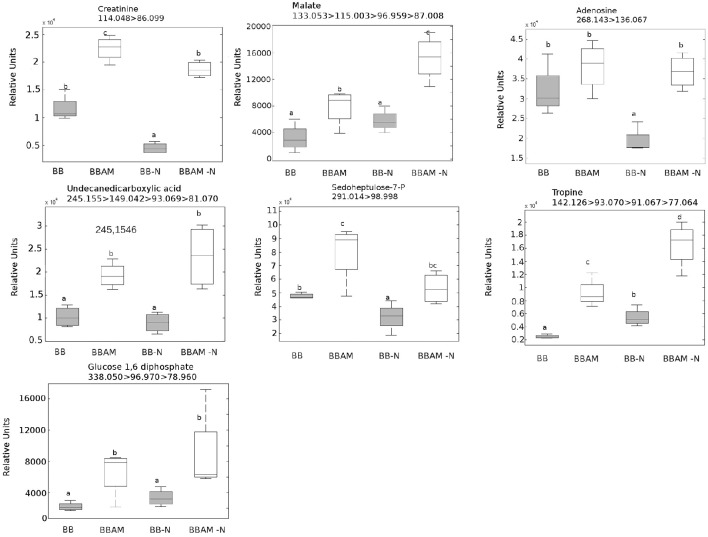
Figure 9.
Metabolites accumulated in mycorrhizal plants compared with non-mycorrhizal plants either normally fertilized or under a transient N depletion. BBAM and BBAM-N plants belong to clusters 1, 2 and 3 of Figure 3. Metabolites were precisely identified by confirming their fragmentation mass spectrum. Non-mycorrhizal infected tomato plants (BB), mycorrhizal infected tomato plants (BBAM); (−N) 48 h of nitrogen starvation and fungal inoculation at 72 hpi. Leaf material from 3 individual plants was pooled for each treatment combination. Box plots represent the means for three independent experiments with two technical replicates. Different letters indicate statistically significant differences (ANOVA, LSD test; P < 0.05, n = 6).

