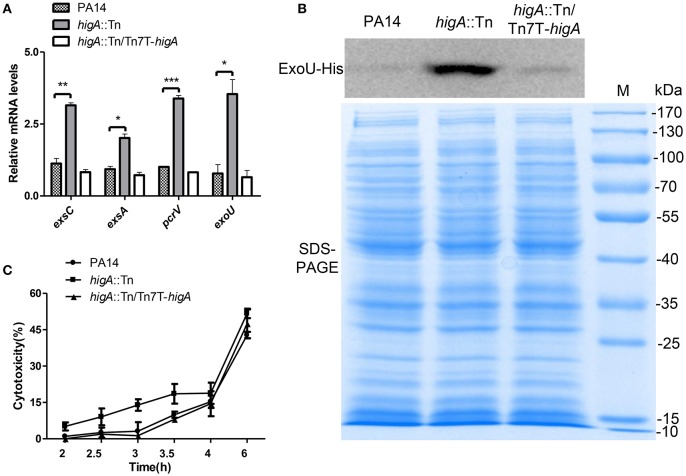
Figure 3.
Expression levels of T3SS genes in wild type PA14, the higA::Tn mutant and complemented strain. (A) Relative mRNA levels of exsC, exsA, pcrV, and exoU in indicated strains at exponential growth phase (OD600 = 0.8~1.0). Error bars represent the standard errors. *p < 0.05, **p < 0.01, ***p < 0.005 compared to wild type PA14 by Student's t-test. (B) Bacteria carrying an exoU-His driven by its native promoter (PexoU-exoU-His) were grown in LB at 37°C. At the OD600 of 1.0, bacteria were collected. Samples from equivalent bacterial cells were loaded into SDS-PAGE gels and stained with Coomassie blue or probed with an anti-His antibody. (C) Raw264.7 cell were infected by indicated strains at an MOI of 10. At indicated time points, the relative cytotoxicity was determined by the LDH release assay.

