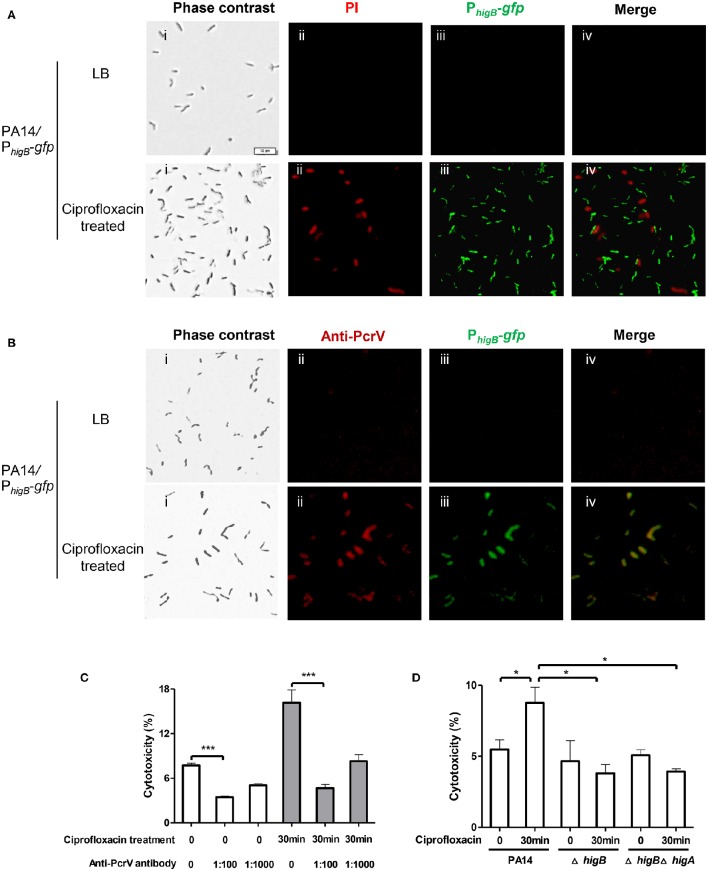
Figure 5.
Levels of HigB, PcrV and cytotoxicity of bacterial cells that survived ciprofloxacin treatment. PA14/PhigB-gfp was cultured in the presence of 0.025 μg/ml ciprofloxacin for 2 h and then treated with 0.125 μg/ml ciprofloxacin for 30 min. The bacteria were washed with PBS twice, stained with PI (A) or fixed and permeabilized and then stained with rabbit anti-PcrV, followed by Alex Fluor 594–labeled goat anti–rabbit immunoglobulin. Bar = 10 μm (B). Quantification of fluorescence positive cells was based on analysis of about 100 cells from three different samples. (C) Wild type PA14 was cultured in the presence of 0.025 μg/ml ciprofloxacin for 2 h and then treated with 0.125 μg/ml ciprofloxacin for 30 min. Raw264.7 cells were infected with the surviving bacteria or bacteria grown in LB at an MOI of 10 for 3.5 h. The anti-PcrV antibody was added to the medium at indicated dilutions. The relative cytotoxicity was determined by the LDH release assay. Error bars represent the standard errors. (D) Wild type PA14, the ΔhigA or ΔhigAΔhigB mutant was cultured in the presence of 0.025 μg/ml ciprofloxacin for 2 h and then treated with 0.125 μg/ml ciprofloxacin for 30 min. Raw264.7 cells were infected with the survived bacteria or bacteria grown in LB at an MOI of 10 for 3.5 h. The relative cytotoxicity was determined by the LDH release assay. Error bars represent the standard errors. Each graph represents the results of three independent experiments. *p < 0.05, ***p < 0.005 by Student's t-test.

