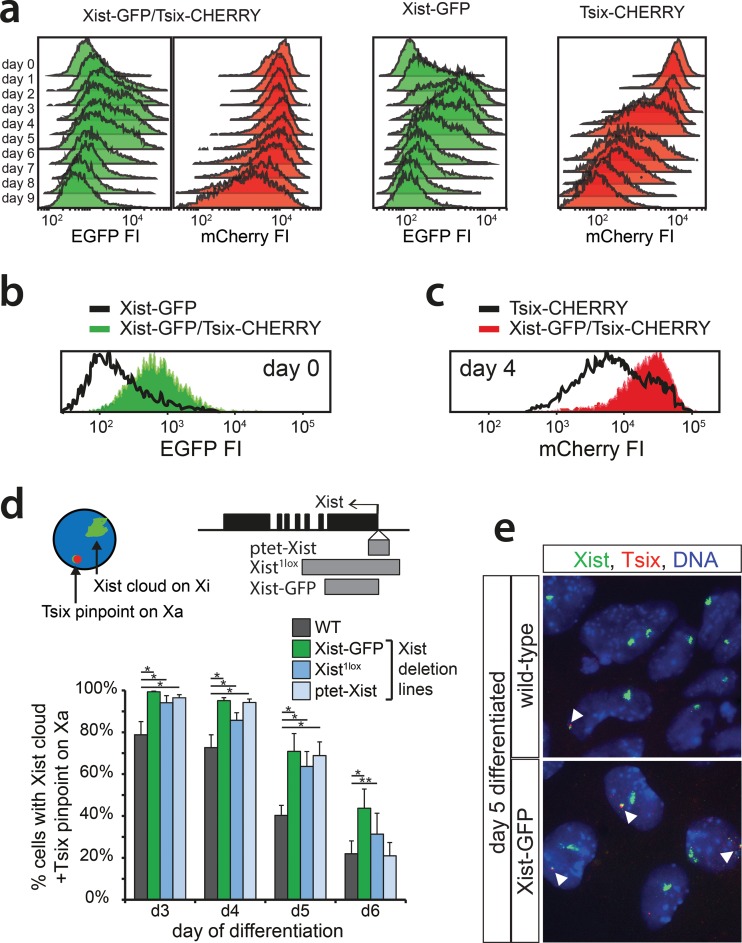
FIG 2.
Xist and Tsix reporter lines reveal antagonistic roles for Xist and Tsix. (a) Histograms of EGFP and mCherry FI distributions as determined by FACS analysis. Days 0 through 9 of differentiation are depicted for Xist-GFP, Tsix-CHERRY, and Xist-GFP/Tsix-CHERRY cells. (b and c) Histograms of EGFP (b) and mCherry (c) FI distributions as determined by FACS analysis. Black outlines represent the undifferentiated Xist-GFP single-knock-in cell line (b) and the Tsix-CHERRY single-knock-in cell line at day 4 of differentiation (c). Solid colors represent FI distributions for Xist-GFP/Tsix-CHERRY. (d) Quantification of two-color RNA FISH to detect Xist and Tsix transcripts at different time points of differentiation. The proportion of cells with an Xist cloud, identifying Xi and a Tsix pinpoint from Xa, is shown. The top right panel shows the exon-intron structure of Xist, and gray bars indicate the deleted region of the respective deletion lines. Error bars indicate 95% confidence intervals (n > 150 for all time points and cell lines). Asterisks indicate a P value of <0.05 (*) or a P value of <0.1 (**) by a two-proportion z test. (e) Xist/Tsix two-color RNA FISH of wild-type and Xist-GFP cells. The green probe detects Xist and Tsix, and the red probe detects only Tsix. Xi is identified by the presence of a Xist cloud, and Tsix transcription from Xa is indicated by the presence of a separate two-color pinpoint in the same nucleus.

