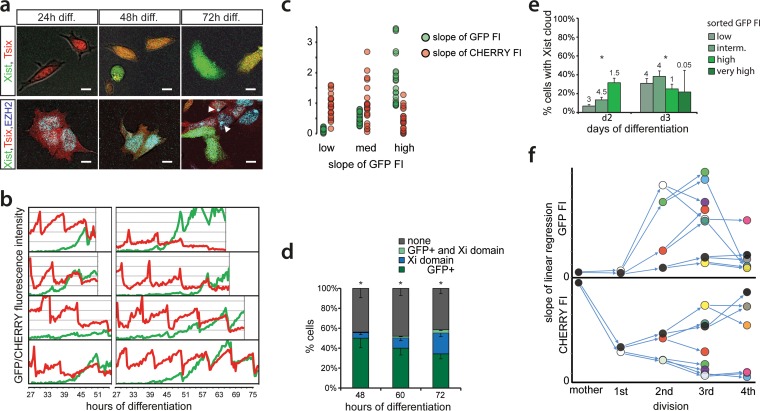
FIG 3.
Time-lapse imaging of live cells. (a) Exemplary pictures of Xist-GFP/Tsix-CHERRY cells (top) and Xist-GFP/Tsix-CHERRY+mTagBFP2-Ezh2 cells (bottom) taken at different time points of differentiation during time-lapse imaging. Bars, 5 μm. (b) Whole-cell integrated FI values for EGFP (green) and mCherry (red) plotted over time for several exemplary cells during time-lapse imaging. (c) Linear regression of FI over time for each cell cycle. The slope of the linear regression as a proxy for promoter activity is plotted. Values for EGFP FIs are binned into low (lowest tercile), medium (intermediate tercile), and high (highest tercile), and the corresponding values for mCherry are plotted next to these values. (d) Quantification of the presence of the mTagBFP2-Ezh2 focus/Xi domain and/or high levels of EGFP at different time points of differentiation in Xist-GFP/Tsix-CHERRY+mTagBFP2-Ezh2 cells. Error bars indicate 95% confidence intervals (n = 162 for 48 h, n = 215 for 60 h, and n = 277 for 72 h). (e) Day 2 and day 3 differentiating Xist-GFP/Tsix-CHERRY cells were FACS sorted into EGFP-low, -intermediate, -high, and -very-high fractions. Graphs show quantification of Xist RNA FISH in these fractions. The number on top of each fraction represents the relative abundance within the population before sorting. Error bars indicate 95% confidence intervals (n > 250 for all time points and fractions). (f) Pedigree of an exemplary cell monitored through four cell divisions. (Top) The slope of the linear regression as described above for panel c is shown for EGFP FI. (Bottom) Slope of the linear regression for mCherry. The same-colored dots represent the same cell and thus indicate values for EGFP in the top panel and mCherry in the bottom panel. Arrows connecting dots indicate a mother cell-to-daughter cell relationship. Asterisks in panels d and e indicate a P value of <0.05, as calculated by a chi-square test.

