FIG 4.
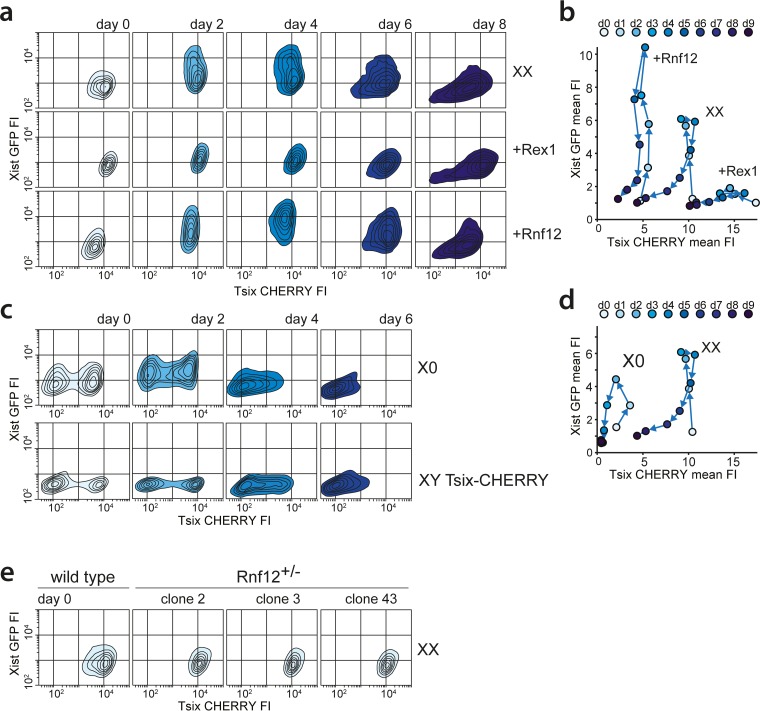
Impact of the RNF12-REX1 regulatory network on Xic regulation. (a) Contour plots data from FACS analysis showing EGFP and mCherry FIs at different time points of differentiation for Xist-GFP/Tsix-CHERRY (XX), Xist-GFP/Tsix-CHERRY+Rex1 (+Rex1), and Xist-GFP/Tsix-CHERRY+Rnf12 (+Rnf12) cells. For all experiments, 100,000 cells were analyzed per time point. Starting from the outermost contour, lines represent 7.5%, 22.5%, 37.5%, 52.5%, 67.5%, and 82.5% of the total events (logarithmic scale). (b) Same as panel a but with mean FIs for EGFP and mCherry plotted (linear scale). (c) Contour plots of data from FACS analysis showing EGFP and mCherry FIs at different time points of differentiation for the XGTC-XO (top) and XY Tsix-CHERRY (bottom) lines. Starting from the outermost contour, lines represent 7.5%, 22.5%, 37.5%, 52.5%, 67.5%, and 82.5% of the total events (logarithmic scale). (d) Same as panel d but with mean FIs for EGFP and mCherry plotted for the XGTC-XO line (linear scale). (e) Contour plots of data from FACS analysis showing EGFP and mCherry FIs in undifferentiated Xist-GFP/Tsix-CHERRY (XX) cells and for clones 2, 3, and 43 of Xist-GFP/Tsix-CHERRY Rnf12+/− ES cell lines. Starting from the outermost contour, lines represent 7.5%, 22.5%, 37.5%, 52.5%, 67.5%, and 82.5% of the total events (logarithmic scale).

