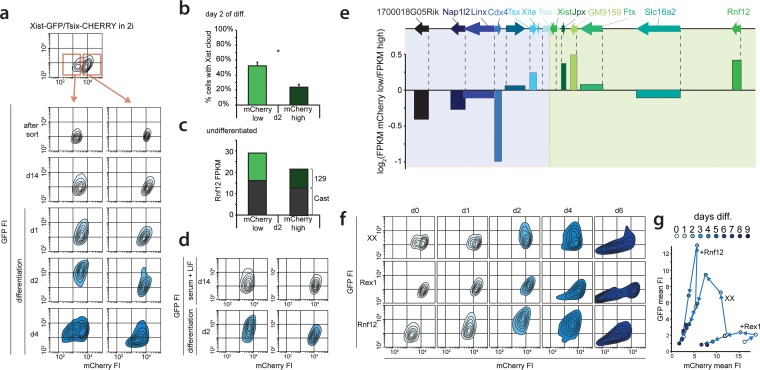
FIG 6.
Two stable states of Xic predict XCI potential in XX cells. (a) Contour plots of data from FACS analysis showing EGFP and mCherry FIs for the Xist-GFP/Tsix-CHERRY ES cell line grown in 2i+LIF. The top panel depicts the original population with a bimodal mCherry distribution, and at the bottom, the sorted mCherry-low and -high populations (as indicated by the red-outlined boxes and arrows) are shown directly after the sort, 14 days after the sort, and upon differentiation. Starting from the outermost contour, lines represent 7.5%, 22.5%, 37.5%, 52.5%, 67.5%, and 82.5% of the total events. (b) Quantification of Xist RNA FISH in female Xist-GFP/Tsix-CHERRY cells at day 2 of differentiation after sorting of mCherry-low and -high populations. Error bars indicate 95% confidence intervals (n = 313 for mCherry-low and n = 305 for mCherry-high populations). The asterisk indicates a P value of <0.05 by a two-proportion z test. (c) Allele-specific RNA expression analysis by RNA sequencing. Shown are the FPKM values and allele-specific expression ratios (green, 129/Sv; shading, Cast). (d) Contour plots of 2i+LIF mCherry-high and -low Xist-GFP/Tsix-CHERRY ES cell populations 14 days after a change from 2i+LIF to serum-plus-LIF conditions (top) and 2 days later after the start of differentiation. (e) Expression levels of genes located in Xic as determined by RNA sequencing of 2i+LIF Xist-GFP/Tsix-CHERRY mCherry-low and -high populations. At the top is the location of genes along the X chromosome, and bars show log2(FPKM mCherry-low/FPKM mCherry-high) values. (f) Contour plots of data from FACS analysis showing EGFP and mCherry FIs at different time points of differentiation for Xist-GFP/Tsix-CHERRY (XX), Xist-GFP/Tsix-CHERRY+Rex1 (+Rex1), and Xist-GFP/Tsix-CHERRY+Rnf12 (+Rnf12) ES cells grown under 2i+LIF conditions. Starting from the outermost contour, lines represent 7.5%, 22.5%, 37.5%, 52.5%, 67.5%, and 82.5% of the total events. (g) Same as panel f but with mean FIs for EGFP and mCherry plotted.

