FIG 4.
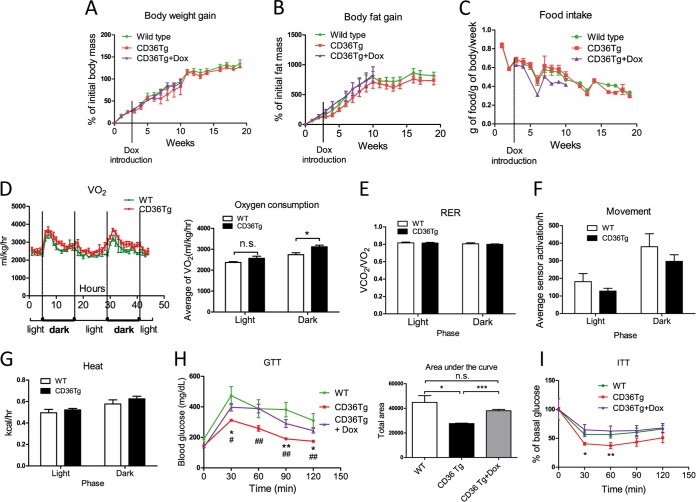
CD36 overexpression improved glucose homeostasis and increased oxygen consumption. All the mice were fed an HFD for 19 weeks. (A to C) HFD-responsive dynamics of body weight gain (A), fat mass gain as measured by magnetic resonance imaging (MRI) (B), and food intake (C) in WT mice and CD36Tg mice treated or not treated with Dox. n = 7 to 9. (D) Oxygen consumption throughout the light-dark cycle. n = 4. (E to G) Metabolic cage analysis of RER (E), locomotive movement (F), and heat generated (G). n = 4. (H and I) GTT (H) and ITT (I) in WT mice and CD36Tg mice treated or not with Dox. The area under the curve (AUC) was used to quantify the GTT results. n = 5. * and #, P < 0.05; ** and ##, P < 0.01; n.s., not statistically significant. The asterisks and hash tags are comparisons between WT and CD36Tg and between CD36Tg and CD36Tg-plus-Dox mice, respectively. The data are presented as means and SEM.

