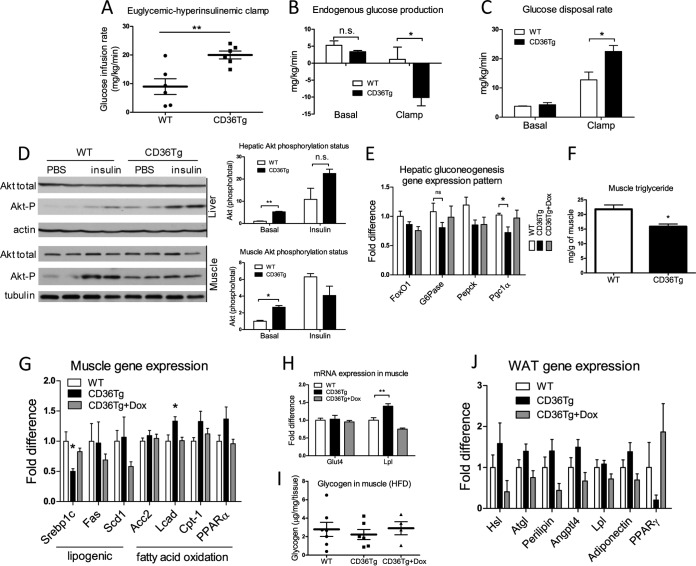
FIG 5.
Hepatic overexpression of CD36 attenuated HFD-induced insulin resistance. The mice are the same as those described in the legend to Fig. 4. (A to C) Euglycemic-hyperinsulinemic clamp measurements of glucose infusion rate (A) endogenous glucose production (B), and glucose disposal rate (C) in HFD-fed WT mice and CD36Tg mice. n = 6 or 7. (D) Basal and insulin-stimulated Akt phosphorylation in liver and skeletal muscle as measured by Western blotting. Shown on the right are densitometric quantifications of the blots. When necessary, mice were injected i.p. with insulin (0.75 U/kg) 17 min before tissue harvesting. (E) Hepatic mRNA expression of gluconeogenic genes. n = 6. (F to I) Triglyceride level (F), expression of genes involved in lipogenesis and fatty acid oxidation (G), expression of the glucose transporter GLUT4 and LPL (H), and glycogen content (I) in skeletal muscle. n = 6. (J) WAT mRNA expression of genes indicative of adipocyte remodeling and metabolism. n = 6. *, P < 0.05; **, P < 0.01; n.s., statistically not significant. The data are presented as means and SEM.

