
Table 2. Clinicopathologic characteristics of the study patients.
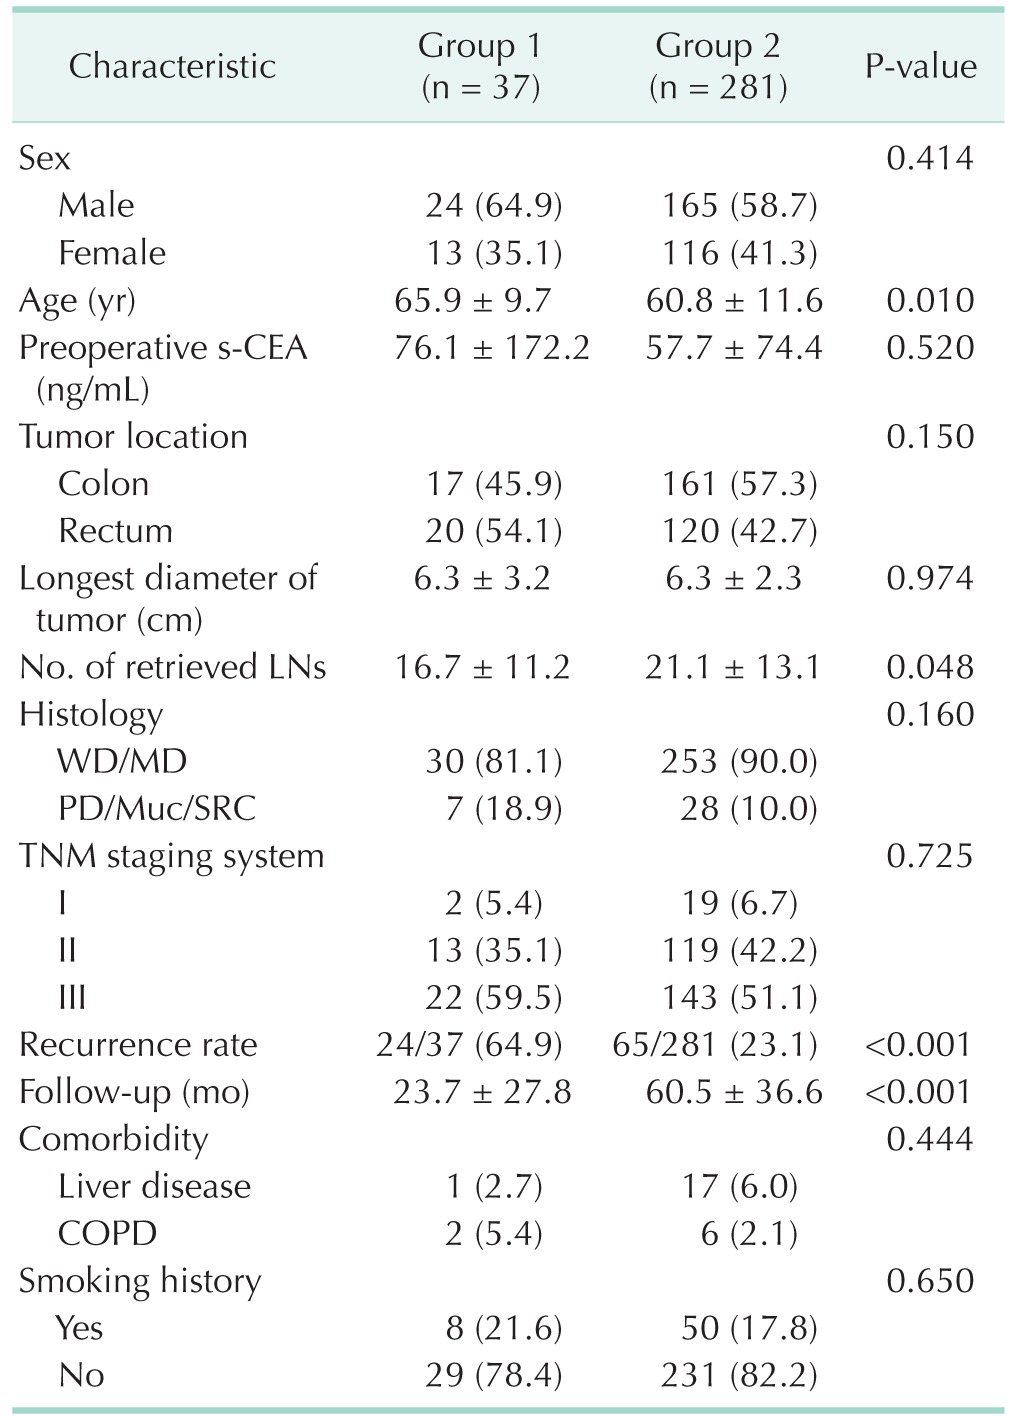
Values are presented as number (%) or mean ± standard deviation. Group 1, persistent elevated s-CEA at 1-year postsurgery; group 2, normalized s-CEA at 1-year postsurgery; s-CEA, serum CEA; LN, lymph node; WD, well differentiated; MD, moderately differentiated; PD, poorly differentiated; SRC, signet ring cell; Muc, mucinous; COPD, chronic obstructive lung disease.