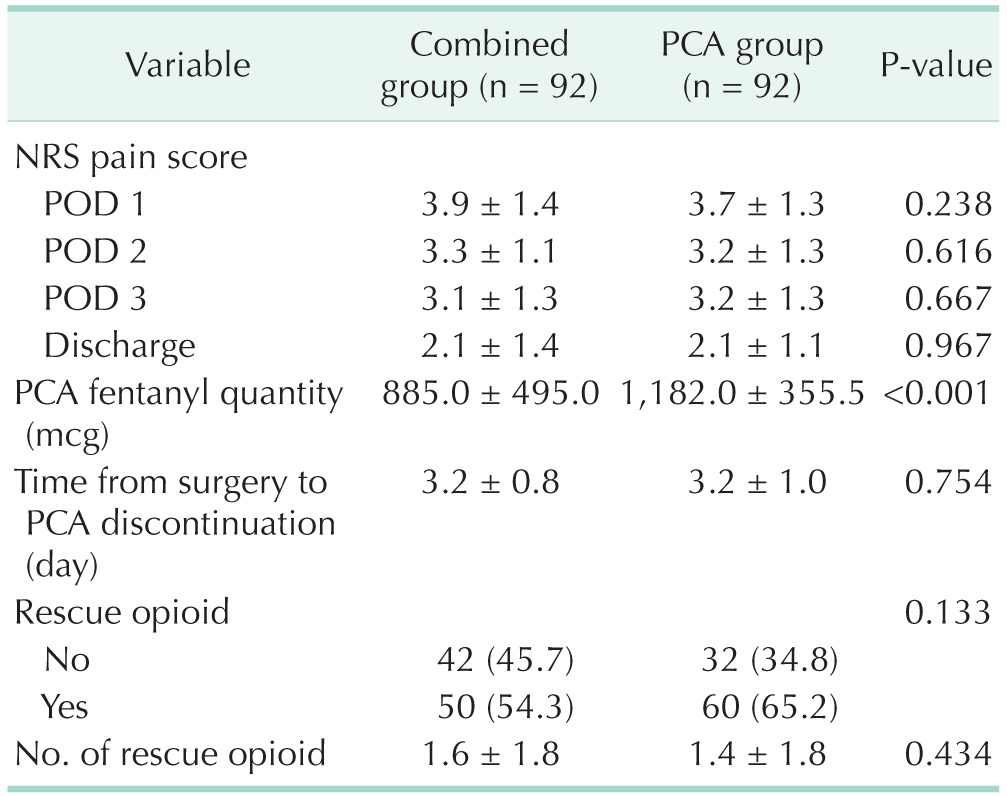
Table 2. Assessment of pain control.

Values are presented as mean ± standard deviation or number (%). Student t-test, chi-square test, and linear by linear association were used.
PCA, patient-controlled analgesia; NRS, numeric rating scale; POD, postoperative day.
P < 0.05, statistically significant differences.
