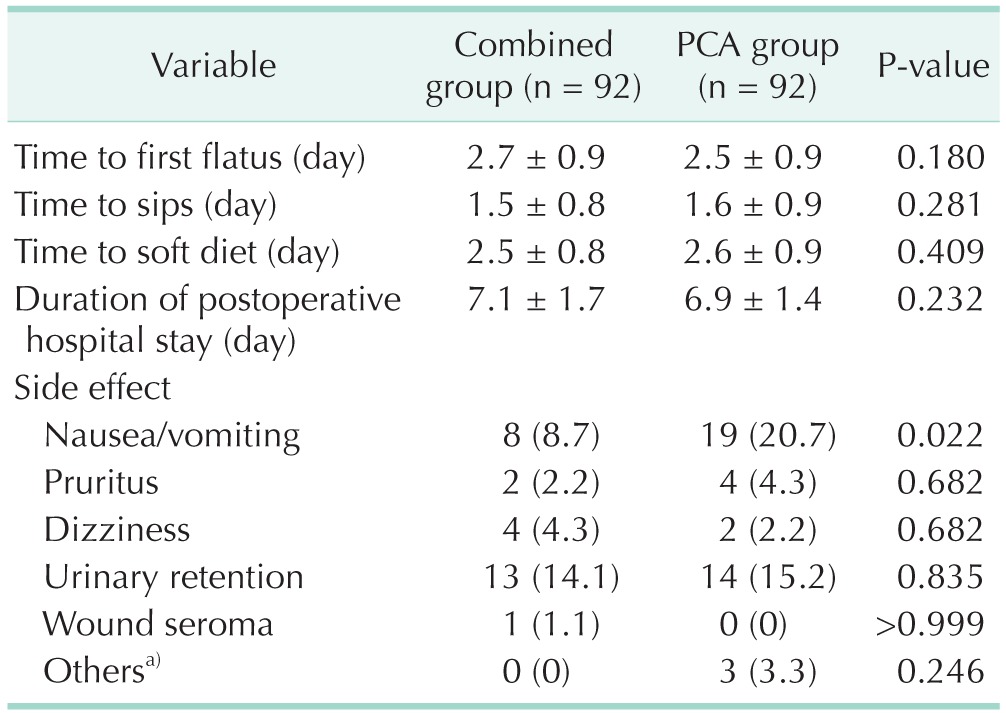
Table 3. Postoperative outcomes.

Values are presented as mean ± standard deviation or number (%). Student t-test, chi-square test, and linear by linear association were used.
PCA, patient-controlled analgesia.
P < 0.05, statistically significant differences.
a)Sweating, palpitations, and atrial flutter.
