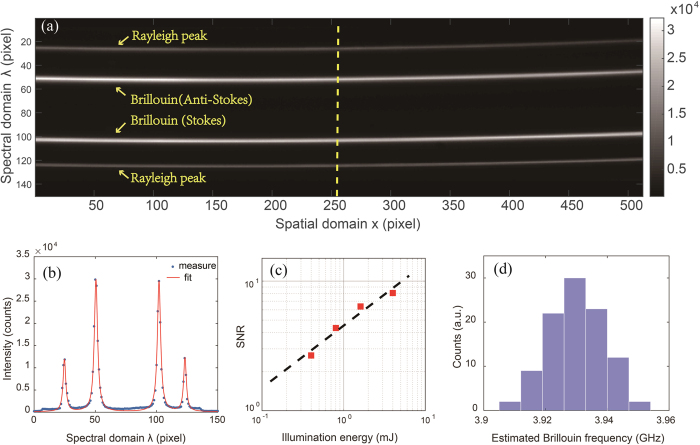
Figure 2. Spectral performances of line-scanning Brillouin microscopy.
(a) Raw dispersion pattern captured by camera. The color map is expressed in terms of CCD camera counts. (b) Spectral pattern at a single point. (c) SNR vs illumination energy on a log-log plot. Square: measured data; dotted line: linearly fitted data. (d) Distribution of the estimated Brillouin frequencies after acquiring the same point in the sample over time.

