
Figure 3. Spatial performance of the Brillouin microscopy.
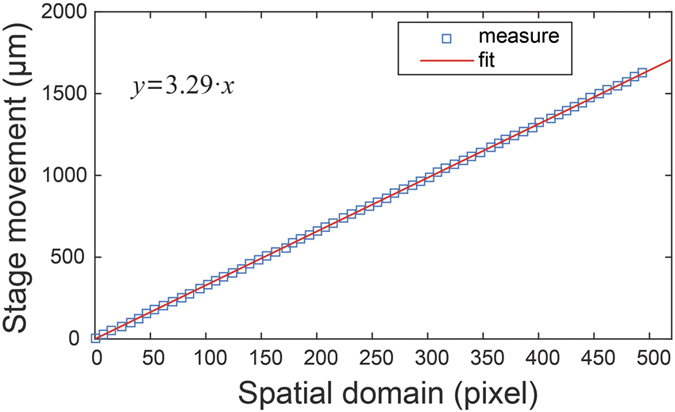
The step movement of the knife-edge at the sample plane (vertical axis) was monitored by the spectrometer’s camera (horizontal axis). The squares are measured data and the red line is linearly fitted data. The slope of the fitted line shows 3.29 microns per pixel.