
Figure 3. Olfr1393 KO mice have improved glucose tolerance as measured by GTT, but perform similarly on an ITT.
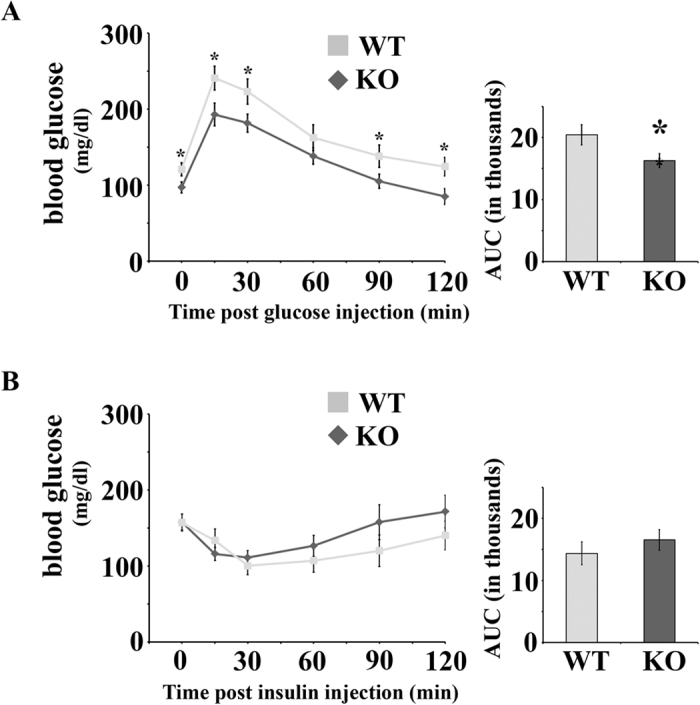
(A) To perform a GTT, WT and KO mice were fasted overnight and injected with 1 g glucose/kg BW. Blood glucose was measured at 0, 15, 30, 60, 90 and 120 minutes following glucose injection. The area under the curve (AUC; in thousands) is displayed to the right of the GTT curve. (WT n = 12 [8 males, 4 females], KO n = 11 [6 males, 5 females]). (B) To perform an ITT, WT and KO mice were fasted for 2 hours and then injected with 0.7 U of insulin. Blood glucose was measured at 0, 15, 30, 60, 90 and 120 minutes following insulin injection and the AUC (in thousands) is displayed to the right of the ITT curve. (WT n = 8 [4 males, 4 females], KO n = 9 [5 males, 4 females]) Data represent ± SEM and * indicates p ≤ 0.05 by the student t-test.