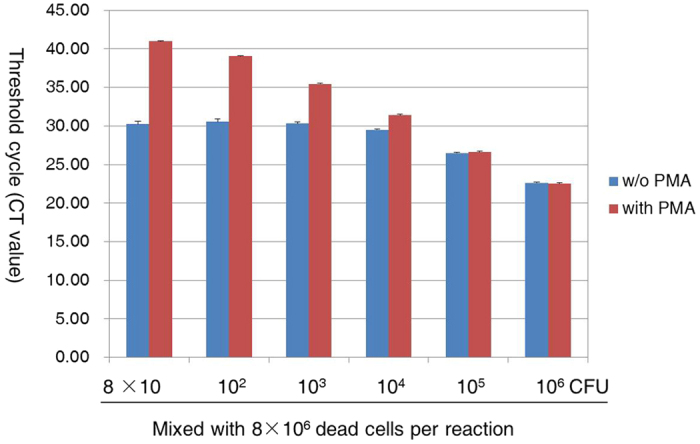
Figure 4. Ct values for viable and dead cell mixtures.

Various mixtures of viable cells (8 × 10⁶ to 8 × 10 CFU/mL) and 8 × 10⁶ CFU/mL dead cells were generated and treated with PMA or left untreated prior to DNA preparation. Each bar represents the average triplicate Ct value.
