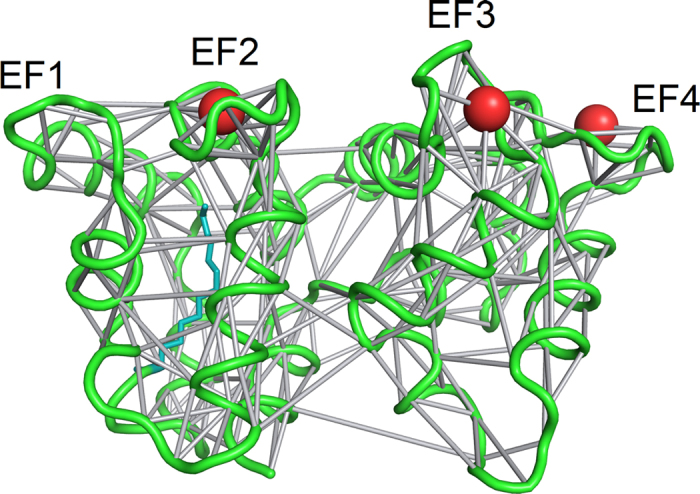
Figure 3. Example of Protein Structure Network calculated with PyInteraph for 1 μs MD simulation of EF2CaEF3CaEF4Ca mGCAP1.

Secondary structure is represented in green cartoons, Ca2+ ions are shown as red spheres, the myristoyl group is represented by teal sticks, edges representing persistent interactions between residues (nodes) are shown as grey sticks connecting Cα-atoms or ions.
