Figure 5.
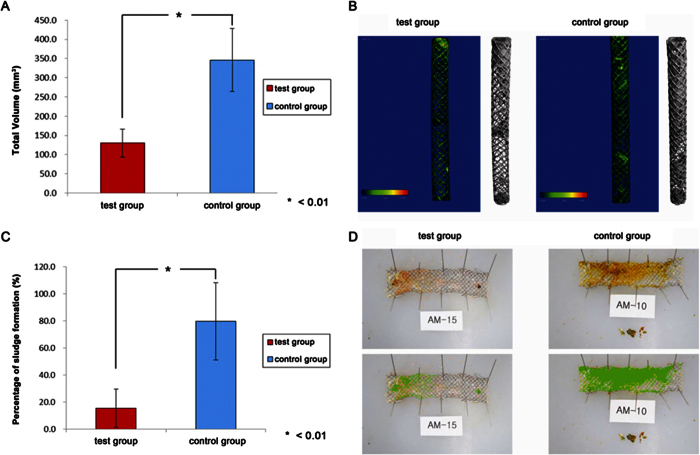
(A) Quantitative sludge analysis by micro-CT. The test group exhibited a significantly lower total sludge volume than the control group (P < 0.01). (B) Total sludge volume in the test and control groups measured by micro-CT. The value (95.20 mm3) of the test group (AM-15, no. 5 in Table 1) was significantly lower than that (301.38 mm3) of the control group (AM-10, no. 4 in Table 1) (average P = 0.001). (C) Quantitative sludge analysis using ImageJ software. The test group exhibited a significantly lower percentage of sludge formation than the control group (P < 0.01). (D) Sludge quantitative analysis. Proportion of sludge formation in the test and control groups is shown. The value (5.3%) of the test group (AM-15) was significantly lower than that (41.0%) of the control group (AM-10) (average P < 0.01).

