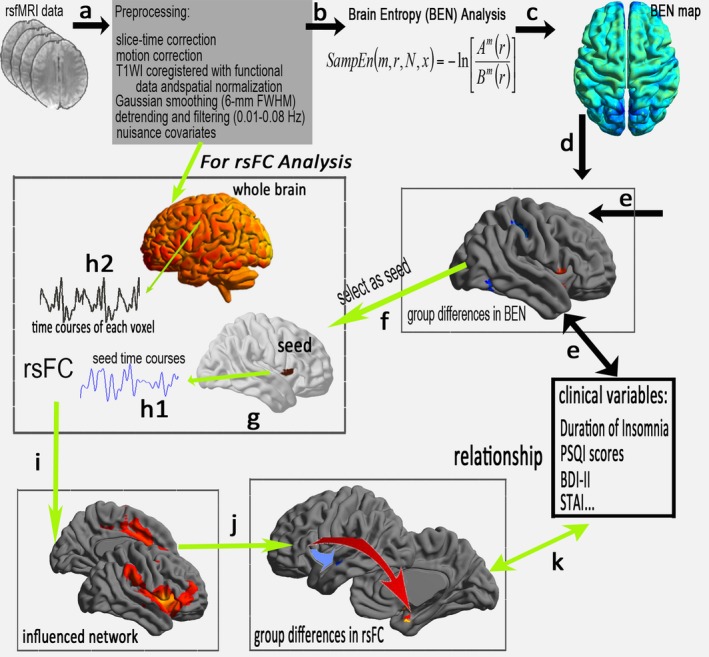
Figure 1.

A flowchart of BEN and the affected connectivity pattern in CPI patients. (a) Preprocessing of rs‐fMRI data. (b) Sample entropy was then used to construct the BEN map in this study. (c) Visualization of the BEN map by group level. (d) Group comparison of BEN and (e) the clinical metrics associated with the altered BEN in CPI patients. To identify the specific networks influenced by BEN, (f) the region with altered BEN was selected as the region of interest (seed, g), and the time series was then extracted in the seed (h1) and each voxel of the whole brain (h2). (i) Calculated rsFC correlations and the constructed influenced network, and (j) a group comparison between the CPI and HC groups. Finally, statistical analysis of the relationship between the clinical metric and the rsFC values measured in the abnormal rsFC region between groups (k)
