Figure 3.

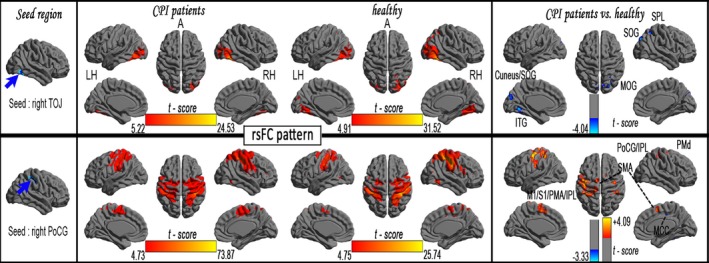
The rsFC patterns in each seed region with significantly reduced BEN in CPI patients (FDR corrected, p < .001) and rsFC differences between the CPI and HC groups

The rsFC patterns in each seed region with significantly reduced BEN in CPI patients (FDR corrected, p < .001) and rsFC differences between the CPI and HC groups