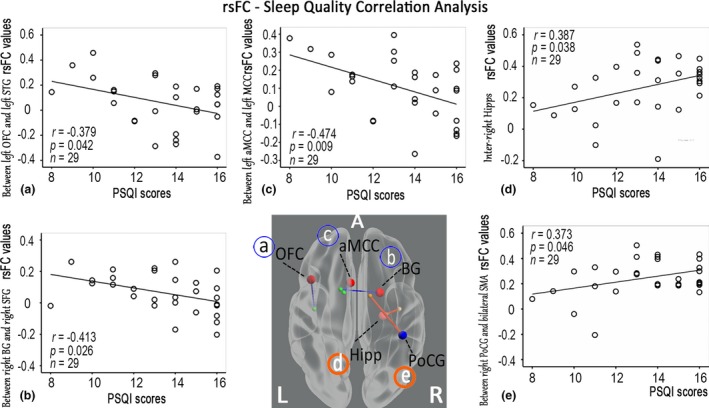
Figure 6.

Relationship between the sleep quality indices and the rsFC values in CPI patients. PSQI scores were negatively correlated with reduced rsFC, but positively correlated with enhanced rsFC in CPI patients. The blue solid line signifies reduced rsFC areas connected with increased BEN (A, IFC; B, BG; C, aMCC), and the orange solid line signifies enhanced rsFC areas connected with altered BEN (D, Hipp; E, PoCG). The larger red sphere indicates increased BEN, the larger blue sphere indicates decreased BEN, and the smaller sphere indicates the rsFC connected areas
