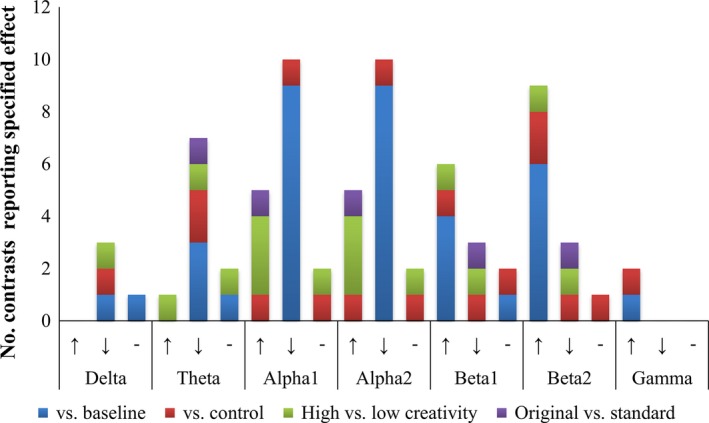
Figure 3.

Summary of the frequency (number of contrasts showing relevant effect) with which studies reported predominant increases (↑), predominant decreases (↓), and no clear pattern of increases or decreases (−) in power in each frequency band. Findings of power changes during visual creativity versus baseline are displayed in blue; power changes versus control tasks in red; differences between high‐ and low‐creativity participants in green; and differences between production of original versus standard images in purple
