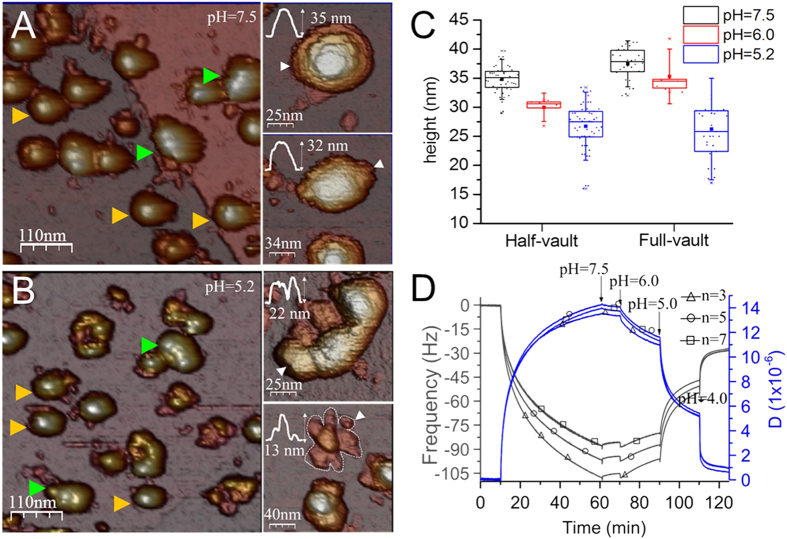
Figure 2.
(A) General AFM topography of particles at pH 7.5. The image shows vaults with different configurations: reclined full-vault (green arrowheads) or half-vault (yellow arrowheads). High-resolution AFM images of vaults at pH 7.5 are shown on the right: half vault (top) and reclined full-vault (bottom). The white arrowheads indicate the line along which the height profile was taken. (B) AFM image of an area after lowering the pH to 5.2. Arrowheads indicate half-vaults (yellow) and reclined full-vaults (green). The images on the right show two typical vault structures found at pH 5.2: reclined particle (top), half-vaults and flower-like structures (bottom). Color scale bar: white-brown-purple, from the highest points to the substrate. (C) Box plot of the particles height at pH 7.5, 6.0 and 5.2. Both configurations (reclined full-vault and half-vault) show a progressive decrease in height. The error bar corresponds to the standard deviation, and the box range indicates percentile Q1 and Q3. The mean is indicated with a solid square. (D) QCM-D analysis of vault particles. Traces show the frequency in black (Y1 axis) and dissipation in blue (Y2 axis) for three overtones (n = 3, 5 and 7, corresponding to 15 MHz, 25 MHz and 35 MHz). After loading the particles on the gold-coated crystal the buffer was exchanged three times: from pH 7.5 to 6.0, 5.0 and 4.0 (black arrows). Evident changes in frequency and dissipation were observed every time that the pH was changed.

