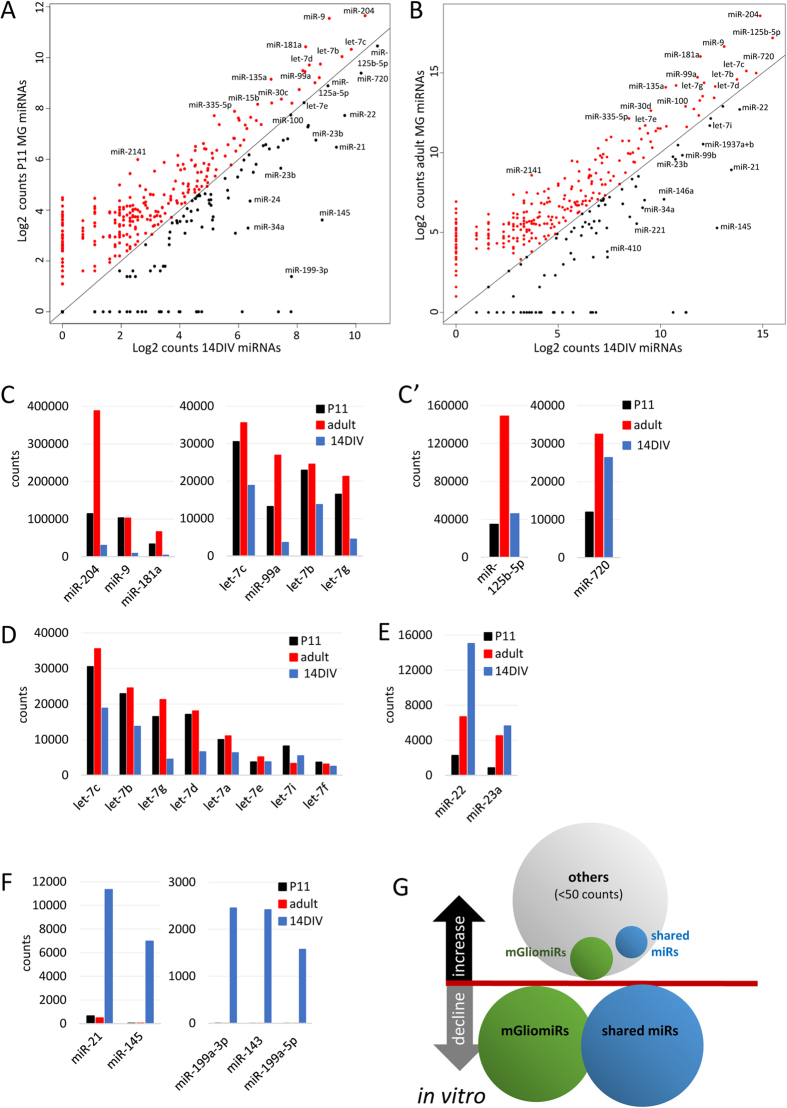
Figure 5. Comparison of the miRNA profile of MG in vivo and MG in vitro.
(A) Scatter plot of Log2 counts of the miRNAs expressed in P11 MG and 14 DIV MG. The red dots represent miRNAs expressed higher in P11 MG in vivo than in 14 DIV MG, the black dots miRNAs more highly expressed in 14 DIV MG than in P11 MG in vivo. (B) Scatter plot of Log2 counts of the miRNAs expressed in adult MG and 14 DIV MG. The red dots represent miRNAs expressed more highly in adult MG in vivo than in 14 DIV MG, black dots miRNAs more highly expressed in 14 DIV MG than in adult MG in vivo. C,C’: Bar graphs of the top 9 miRNAs in which expression levels decreased after 14 DIV as compared to P11 or adult MG in vivo (C) or decreased as compared to adult MG but increased as compared to P11 MG (C’, bar graphs cutoff 20,000 counts, decrease >10%). (D) Bar graph of eight let-7 family members in P11 and adult MG in vivo, and MG maintained for 14 DIV. (E) Bar graph of two miRNAs in which expression levels increased after 14 DIV (bar graph cutoff 5,000 counts, increase >10%). (F) Bar graphs of 5 miRNAs in which expression levels increased substantially in vitro. (G) Summary of the changes in the miRNA profile of MG in vitro (data from 8 DIV and 14 DIV) as compared to MG in vivo (P11 and adult MG). Shown are the defined categories: mGliomiRs (high expression in MG with >2,000 counts, <20% expression in neurons) and shared miRs (highly expressed in MG with >2,000 counts but >20% expression in neurons or glia). miRNAs assigned as “others” are miRNAs not expressed in adult MG in vivo (<50 counts). The bubble size represents the percentage of the number of miRNAs that decline and/or decrease of the total number of miRNAs of the particular category, i.e., 72% mGliomiRs and 79% of the shared miRs declined in vitro as compared to the expression levels from freshly isolated adult MG; 28% mGliomiRs, 21% shared miRs, and 100% of other miRNAs increased in vitro. The range of increase or decline is given in the brackets.

