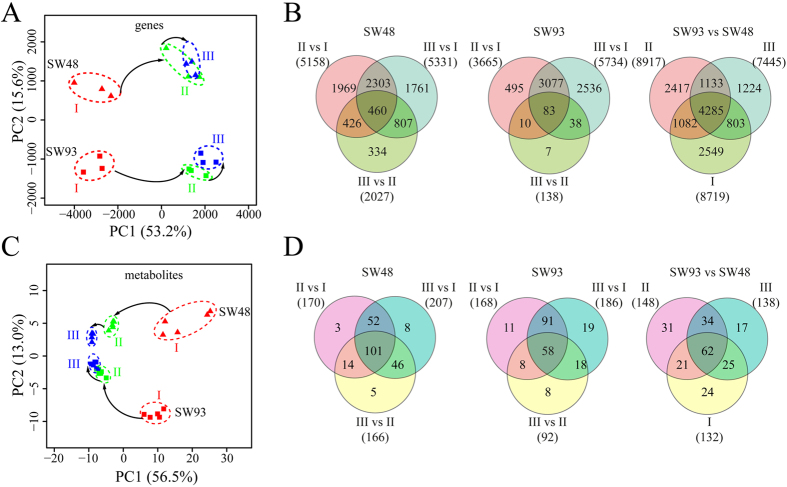
Figure 2. The overview of the transcriptomic and metabolomic changes in developing maize kernels.
(A,C) Principle component analysis of detected transcriptomic data and metabolomic data, respectively. Red, green and blue colors represent samples at I, II and III, respectively. Box and triangle denote samples of SW93 and SW48, respectively. I, II and III refer to 11, 16 and 21 DAP, respectively. (B,D) Venn diagrams of differentially expressed genes (DEGs), and differential metabolites (DAMs), of maize kernel at different time points of the same cultivar and at the same time point of different cultivars. I, II and III refer to 11, 16 and 21 DAP, respectively.

