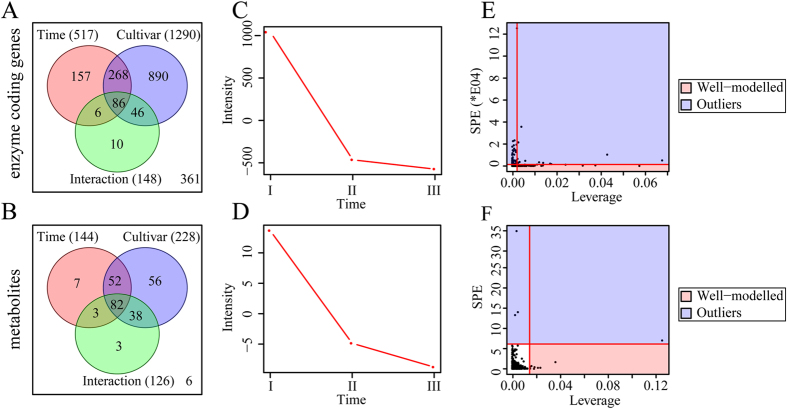
Figure 3. Result of two-way ANOVA and ASCA.
(A,B) Venn diagram of enzyme coding genes and metabolites whose levels were affected by time, cultivar or time-cultivar interaction; (C,D) Major pattern of enzyme coding genes and metabolites associated with time. I, II and III refer to 11, 16 and 21 DAP, respectively; (E,F) ASCA selection of important enzyme coding genes and metabolites associated with time by Leverage/SPE analysis. These analysis was performed in MetaboAnalyst website http://wwwmetabolanalyst.ca website63.

