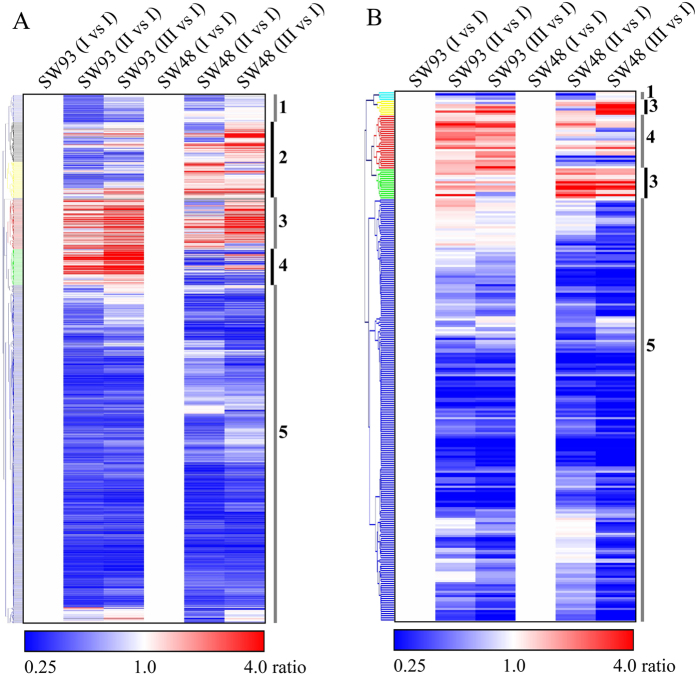
Figure 4. Hierarchical clustering analysis of the transcriptomic and metabolomic data.
(A) enzyme coding genes; (B) metabolites. Red color indicate the abundance of enzyme coding gene or metabolite tends to be up-regulated compared to that at I of the same cultivar and blue down-regulated see ratio color key. 1 and 5, cluster 1 and cluster 5: down-regulated in both SW93 and SW48; 2, cluster 2: down-regulated in SW93, but up-regulated in SW48; 3, cluster 3: up-regulated in both SW93 and SW48; 4, cluster 4: up-regulated in SW93, but down-regulated in SW48.

