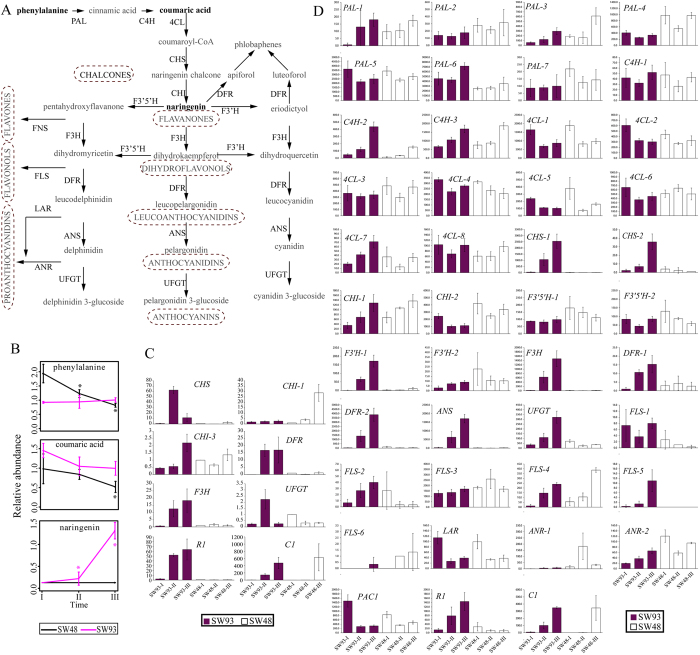
Figure 5. Integration of gene expression and metabolite changes of flavonoids pathway.
(A) Simplified map of anthocyanin biosynthesis pathway modified from Petroni et al.21. The font style of the identified metabolites were set to be bold. PAL, phenylalanine ammonia lyase; C4H, cinamic acid 4-hydroxylase; 4CL, 4-coumarate CoA ligase; CHS, chalcone synthase; CHI, chalcone isomerase; DFR, dihydroflavonol reductase; F3′H, flavanone 3′-hydroxylase; F3H, flavanone 3-hydroxylase; F3′5′H, flavonoid 3′,5′-hydroxylase; ANS, anthocyanidin synthase; UFGT, UDP-flavonoid glucosyl transferase; FNS, flavone synthase; FLS, flavonol synthase; LAR, leucoanthocyanidin reductase; ANR, anthocyanidin reductase. B, Changes in metabolite levels in maize kernels along the development. *denotes the metabolite level at II (16 DAP) or III (21 DAP) was significantly different from that at I (11 DAP) of the same cultivar. Black and purple stars denote SW48 and SW93, respectively. C, Changes in expression levels of genes involved in flavonoids pathway as revealed by qRT-PCR. C1, colored aleurone 1 or colorless1; R1, red color 1. The y-axis represents the relative abundance of each gene. The mean expression level of each gene at I of SW48 was denoted as 1. CHS: GRMZM2G422750 and GRMZM2G151227; CHI-1: GRMZM2G119186; CHI-2: GRMZM2G155329; DFR: GRMZM2G026930 and GRMZM2G013726; F3H: GRMZM2G062396. C1: GRMZM2G005066; R1: GRMZM5G822829. D, Changes in expression levels of genes involved in flavonoids pathway as revealed by RNA-Seq. The y-axis represents the counts of genes in SW93 and SW48 by RNA-Seq. The detailed expression profile of each gene was shown in Supplementary Table S8.

