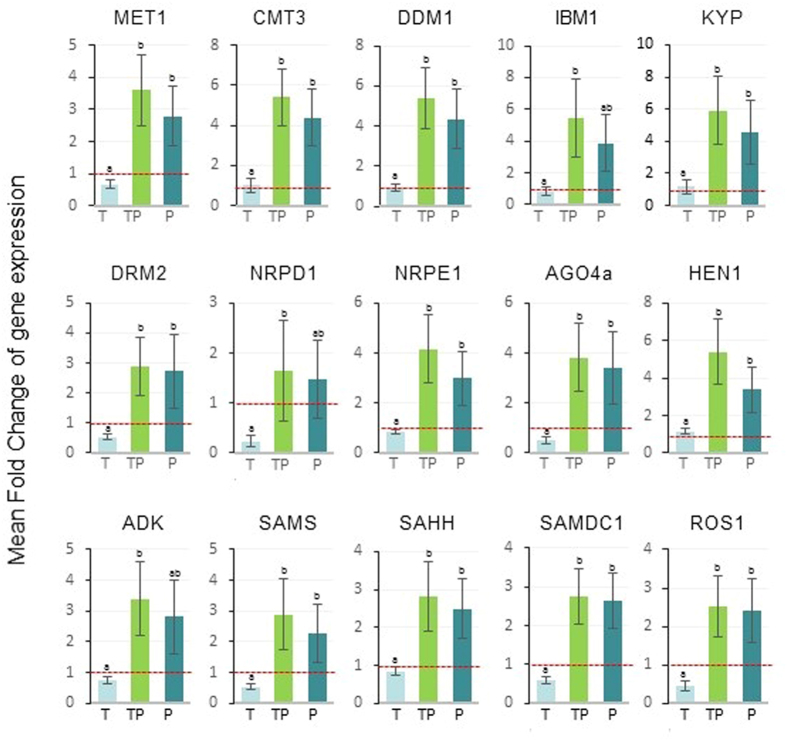
Figure 2. Mean fold change of methylation-related tomato gene expression in plants infected by TYLCSV (T), PSTVd (P) or by TYLCSV/PSTVd (TP), with respect to non-infected control plants.
Data are from three infected vs. non-infected plants; the red line set to 1 on the Y axis (FC = 1) means no change in gene expression. Bars, standard errors; letters, statistical significance (P ≤ 0.05; Student t-test).

