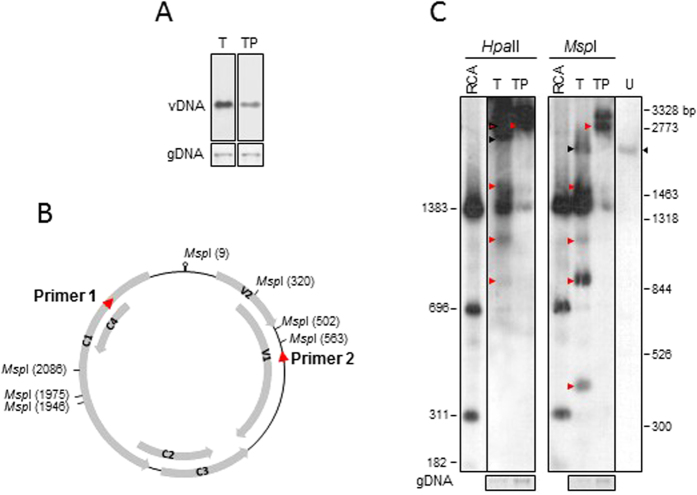
Figure 3. Methylation sensitive restriction enzyme analysis on TYLCSV- or TYLCSV/PSTVd-infected plants.
(A) TYLCSV DNA accumulation in the plants infected by TYLCSV- or by TYLCSV/PSTVd (T and TP, respectively). (B) Position of HpaII and MspI sites in the TYLCSV genome; red arrows, primers to amplify the TYLCSV region for bisulfite analysis (see Fig. 4). (C) MspI or HpaII digestion of plant DNA extracts (fragments indicated by red arrows) and of the RCA amplicon (size in bp indicated on the left). U, undigested ss DNA sample with TYLCSV ssDNA (black arrows); TYLCSV size marker (in bp, on the right) are 2773 (SstI digestion of a TYLCSV clone), 3328, 1318, 844 (SphI/SnaBI), and 1463, 526, 300 (BglII/SalI).

