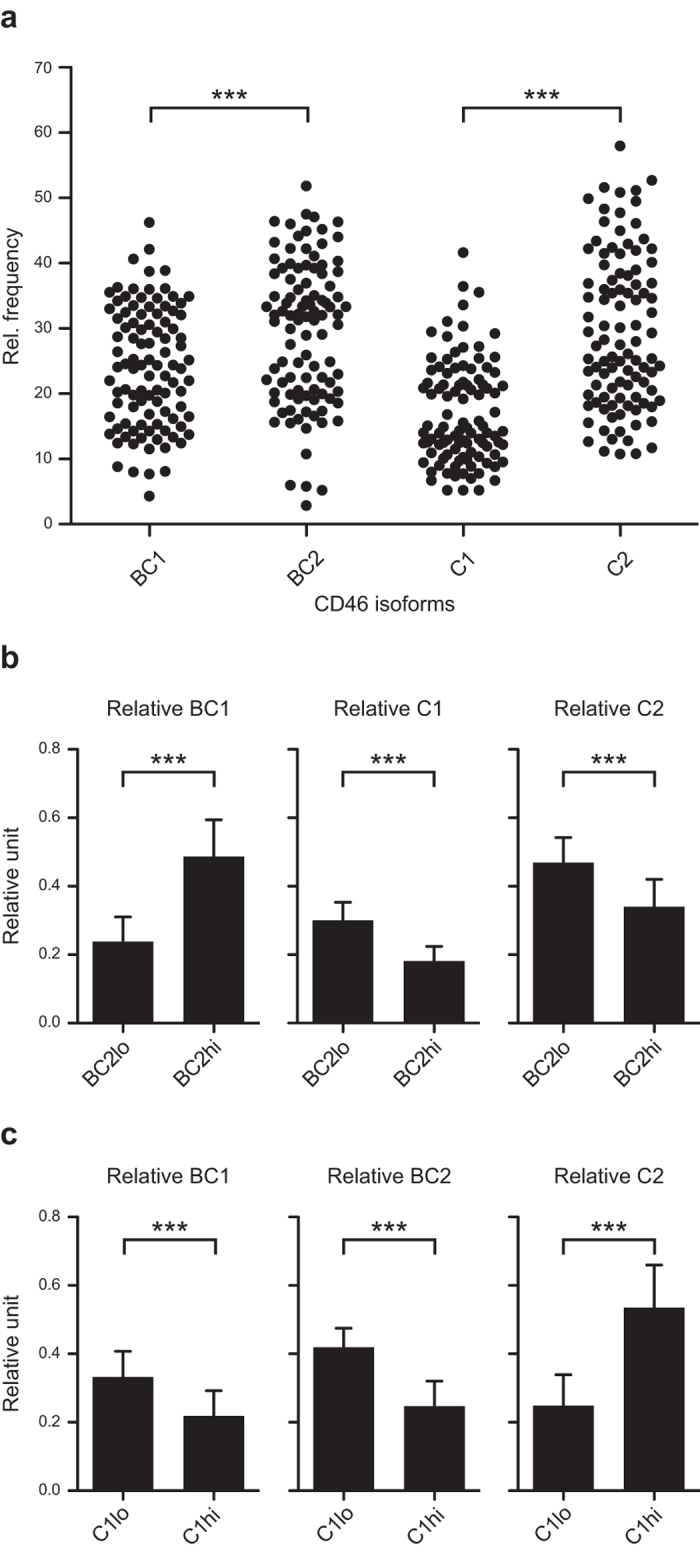
Figure 2. Distribution of different CD46 isoforms in the human population.

(a) CD4+ T cells were isolated from 100 consecutive blood donors (median age 42 years, range 20–64 years, equal gender distribution). The relative mRNA expression of the different CD46 isoforms was measured by real-time PCR and is indicated as a relative frequency. Each dot represents the mean of 3 technical replicates for a given individual for a given isoform. ***indicates P < 0.0001 (Wilcoxon matched pairs signed rank test). (b) Analyses of isoform co-expression in BC2 low (BC2lo) and BC2high (BC2hi) expressing CD4+ T cells separated by the relative frequency of 28% according to the data in (a). Data are shown as relative units defined by the relative expression of the given isoform divided by the summarized relative expression of BC1, C1 and C2. (c) Analyses of isoform co-expression in C1 low (C1lo) and C1high (C1hi) expressing CD4+ T cells separated by the relative frequency of 18% according to data in (a). Data are shown as relative units defined by the relative expression of a given isoform divided by the summarized relative expression of BC1, BC2 and C2. For (b,c) data are represented as mean + SD and ***indicates P < 0.0001 (Mann Whitney test).
