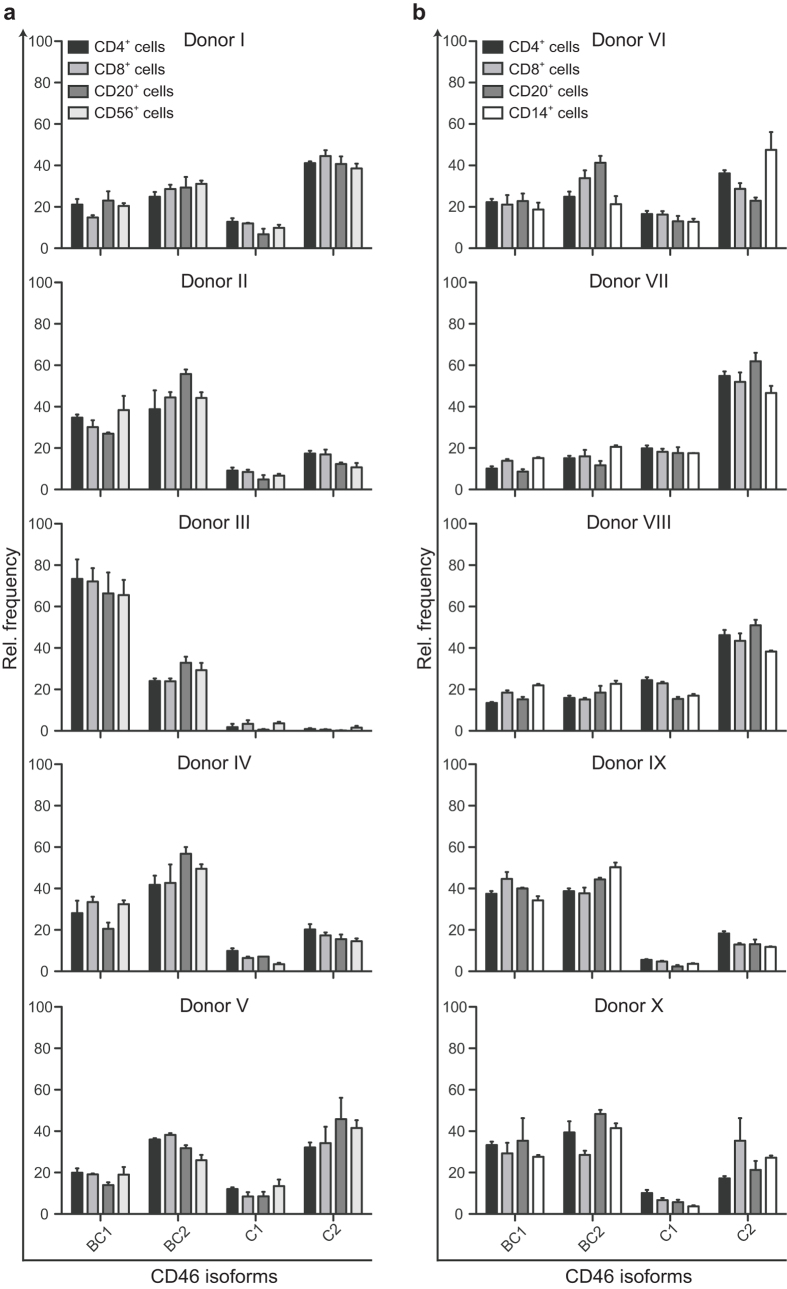
Figure 3. Phenotypic expression profiles of CD46 isoforms on main subpopulations of PBMC.
PBMC from 10 different donors were sorted in subpopulations based on expression of the following surface markers: CD4+, CD8+, CD20+, and CD56+ (a) or CD14+ (b). From each of the populations mRNA was extracted and the relative expression of each of the different CD46 isoforms was analysed by real-time PCR. The expression of each of the different isoforms is shown as a relative frequency. The data are represented as mean + SEM of three technical replicates.

