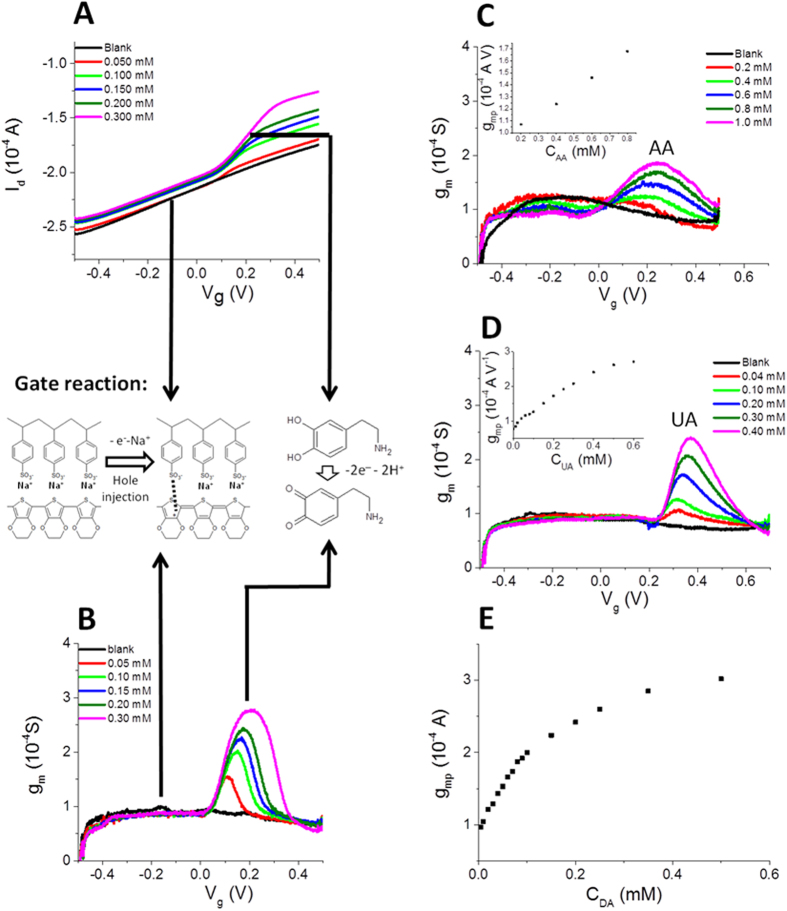
Figure 5.
(A) Transfer curves recorded in a solutions containing DA at different concentrations. (B) Trans-conductance curves obtained from transfer curves reported in Fig. 5A. Trans-conductance curves recorded in a solution containing AA (C) and UA (D) at different concentrations. In the insets the calibration plots are reported. (E) Calibration plot obtained for dopamine. The chemical scheme shows the reactions which take place in different areas of the graphs. Only PEDOT:PSS oxidation occurs in the blank and at low gate voltage (Vg). In the presence of DA, also the DA oxidation occurs at Vg ∼ 0.2 V.

