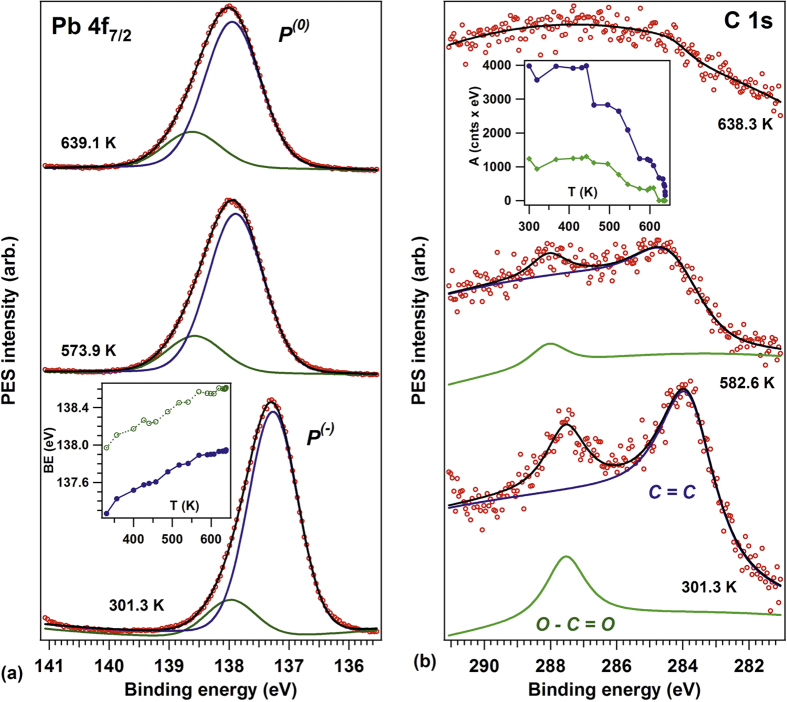
Figure 5.
Evolution of Pb 4f7/2 (a) and C 1s (b) core levels with the sample heating, at temperatures indicated, which are averages between the starting and ending temperature for each spectrum. Photon energy: 400 eV in both cases (Pb 4f7/2 and C 1s). Vertical offsets are artificially introduced for clarity. Inserted in (a) is the evolution of Pb 4f7/2 binding energies of the separated components, inserted in (b) is the evolution of C 1s integral amplitudes for the separated components. The complete series of spectra is represented in the SI (SI-2). The non-linear baseline in the C 1s spectra (kinetic energy range: 110–120 eV) is attributed to a mixture of Pb Auger and Zr Auger transitions.

