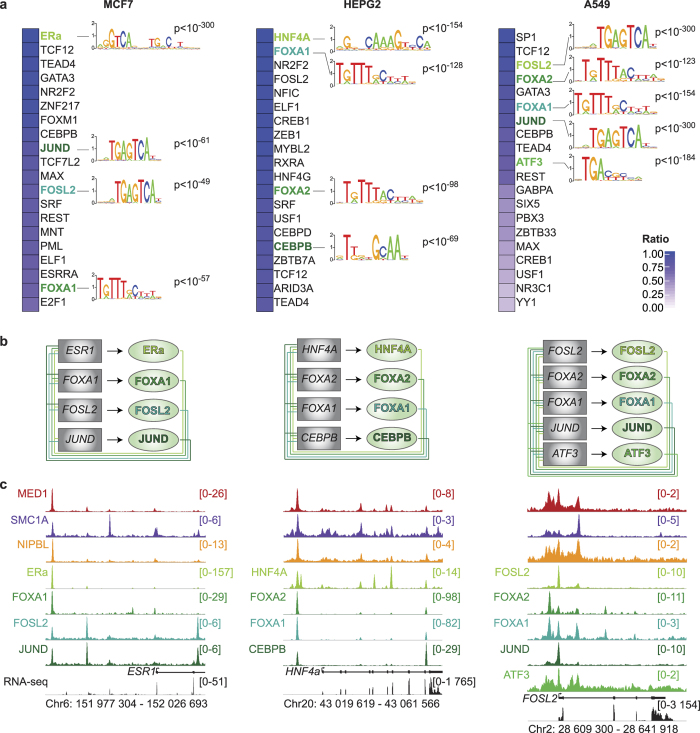
Figure 3. The core circuitry of cancer cells connect with Mediator and Cohesin.
(a) Percentage of overlapping regions occupied by MED1, SMC1A and NIPBL with transcription factors. The best 20 overlaps with transcription factors for each cell type are presented. The color scale indicates the percentage of overlap. The DNA binding motif logos found in the regions occupied by MED1, SMC1A and NIPBL are indicated next to their associated transcription factor. The motifs were found in the top 20 of the most enriched position-weight matrices. The associated p-values are indicated. (b) Core transcriptional regulatory circuitry of MCF7, HEPG2 and A549 cells. The transcription factors identified in (a) are interconnected. The box represents the transcription factor gene loci while the oval represents the protein identified in (a). Each line represents the interaction of a transcription factor with the indicated gene loci (−10 kb to the end of the gene). (c) Occupancy profiles of Mediator (MED1), Cohesin (SMC1A) and NIPBL in addition to the core transcription factors identified in (a) showing colocalization. The ESR1, HNF4A and FOSL2 loci are displayed for MCF7, HEPG2 and A549 respectively. The scales of ChIP-Seq profiles are displayed in reads per million.

