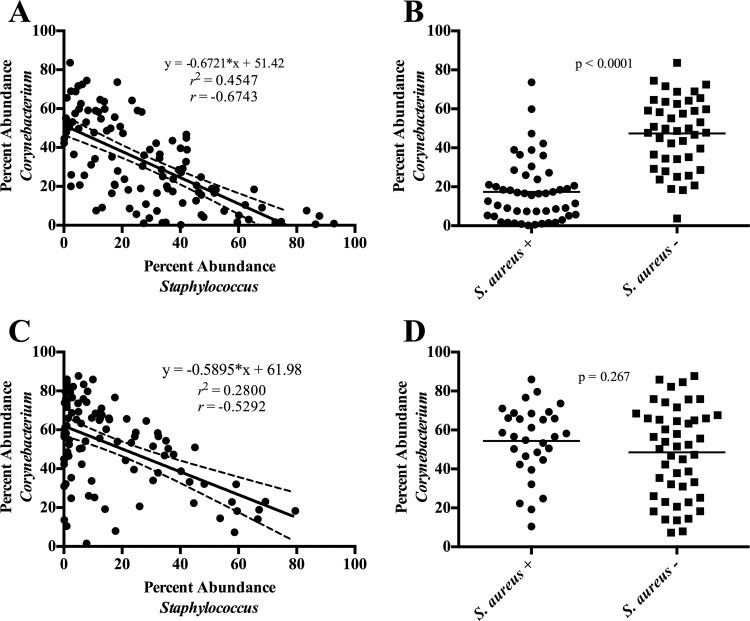
FIG 6 .
Abundance of Corynebacterium compared to the abundance of Staphylococcus (A and C) and Staphylococcus aureus (B and D) for the nasal (A and B) and inguinal (C and D) body sites. Each symbol corresponds to an individual nasal or inguinal sample. For panels A and C, solid lines and inset equations represent the line of best fit [y = slope(x) + y intercept]. Dashed lines represent the 95% confidence interval. r2, coefficient of determination; r, correlation coefficient. For panels B and D, the S. aureus designation was determined by culture. Solid lines correspond to the mean percent abundance. P values shown were generated using the Mann-Whitney statistical test.

