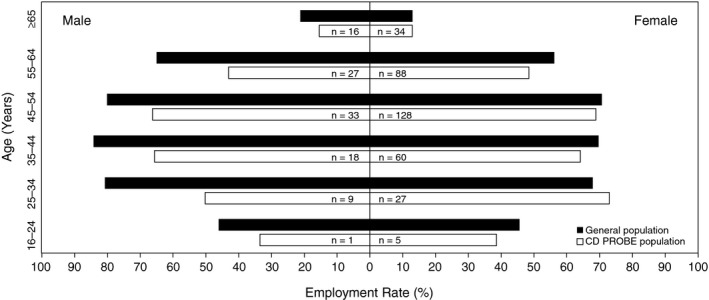
Figure 2.

Employment by age and gender in the CD PROBE and 2009–2012 U.S. populations. For the CD PROBE population, responses of full‐time, part‐time, self‐employed, and other were considered employed, with the number employed indicated within the bars. General population values were from the U.S. Bureau of Labor and Statistics employment population ratio (weighted based on years of recruitment for CD PROBE).
