Figure 1.

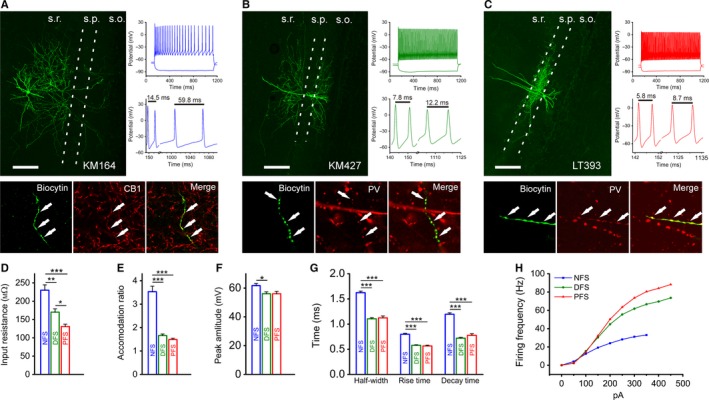
Identification of non‐fast‐spiking and fast‐spiking interneuron types in the hippocampus. (A–C) Confocal maximum intensity projection image (left), immunocytochemical staining (bottom) and firing pattern (top right) – highlighting the accommodation ability (middle right) – of a typical NFS (A), DFS (B) and PFS (C) IN. S.r.: stratum radiatum; s.p.: stratum pyramidale; s.o.: stratum oriens; scale bar, 200 μm. (D) Membrane resistance values at rest for NFS, DFS and PFS INs. (E) Accommodation ratios were determined from the maximal firing responses in which the AP shape was not distorted and calculated as the time elapsed between the last two APs divided by the time between the second and third APs. (F) AP amplitudes in the different groups, which were calculated from responses evoked by the step protocol. (G) Half‐width, rise time and decay time constants of APs in the different types of INs. (H) Average firing frequencies of the different cell populations, which were induced by 0–450 pA current steps with 50‐pA increments. The data shown in this figure are means and SEM. Tukey post‐hoc test after one‐way anova (half‐width, rise time, decay time) and Dunn's post‐hoc test after Kruskal–Wallis test (input resistance, accommodation ratio, peak amplitude from threshold); *P < 0.05, **P < 0.01 and ***P < 0.001.
