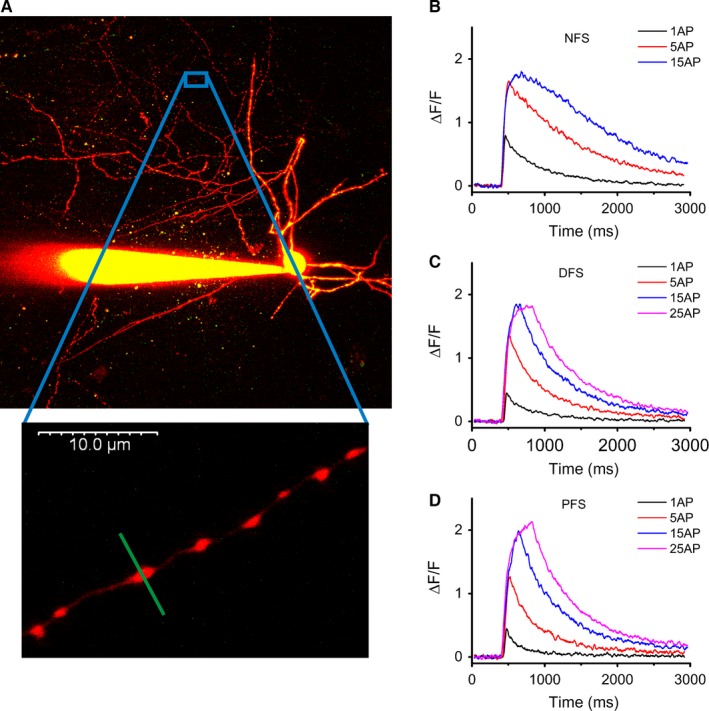
Figure 2.

Characterization of local Ca2+ responses in individual boutons. (A) Two‐photon z‐stack image of an NFS cell (filled with Alexa Fluor 594 and Oregon Green BAPTA‐1) highlighting a short axon branch (bottom). (B–D) Averaged two‐photon fluorescence time‐lapse responses (single AP and five‐, 15‐ and 25‐AP‐evoked transients at 60 Hz) in NFS, DFS and PFS cells. Using the high‐affinity dye OGB‐1 (112 μm), fluorescence signals were most likely saturated at stimulation with 15 APs; n = 4–11 cells, 16–49 boutons.
