Figure 3.

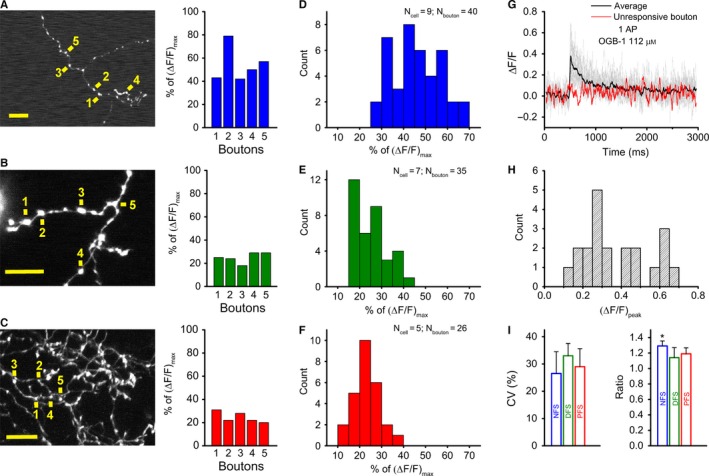
Low variability of individual bouton responses across interneuron types. (A–C) Two‐photon z‐stack images of axonal segments of NFS (A), DFS (B) and PFS (C) cells. Yellow signs next to numbers indicate the individual bouton where single AP‐evoked Ca2+ transients were measured; scale bar, 10 μm (left). The peak amplitude of the Ca2+ transients evoked in five boutons is expressed as a percentage of the saturation level using OGB‐1 (112 μm). (D–F) Bar charts of single‐AP‐evoked peak amplitudes for NFS (blue), DFS (green) and PFS (red) cells. Note that the NFS responses are of the order of approximately 50%, whereas the DFS and PFS responses are approximately 20–30% of the saturation using OGB‐1 (112 μm). (G) Single‐AP‐evoked Ca2+ responses in 21 boutons of the same PFS cell (grey lines denote responsive boutons, red line shows the unresponsive one) with their average (black solid line). (H) Bar chart of the peak amplitudes of the same PFS cell, given as ΔF/F. (I) Variability of single AP‐evoked Ca2+ responses in each IN type, which was calculated as the mean of the coefficients of variation (CVs) of multiple individual cells in which at least five boutons were imaged (left). Because this calculation was based on experiments in which the amplitudes fell in the linear range of the dye (10–30% of saturation), the data for NFS cells were derived from experiments using OGB‐6F (112 μm), whereas the data for DFS and PFS cells were measured with OGB‐1 (56 μm) (n = 3 cells, 16–19 boutons for NFS, DFS and PFS cells). The ratio of single‐AP‐evoked Ca2+ responses in en passant boutons and branching points in NFS (blue), DFS (green) and PFS (red) cells (right). To calculate the ratio, the average of the responses in 3–5 en passant boutons close to the branching points was used; n = 6–7 cells and 8–10 branching points for NFS, DFS and PFS cells. Dunn's post‐hoc test after Kruskal–Wallis test; *P < 0.05.
