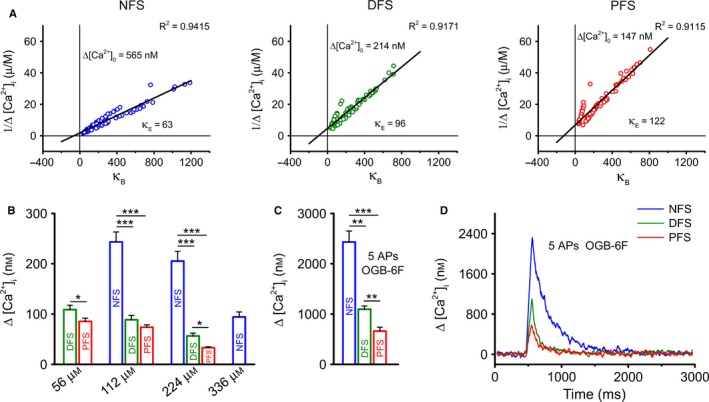
Figure 4.

Cell‐type‐dependent buffering capacity and Δ[Ca2+]i in boutons. (A) Endogenous buffering capacity (κE) in NFS (blue), DFS (green) and PFS (red) INs. Linear regressions for single‐AP‐evoked Δ[Ca2+]i values were calculated at the individual bouton level. Values of 1/Δ[Ca2+]i were plotted as a function of the exogenous binding ratio (κB). The y‐axis intercepts denote the Δ[Ca2+]i in unperturbed conditions (Δ[Ca2+]0), and the x‐axis intercepts indicate κE values. All regressions were highly significant (least squares method; P < 0.001); n = 17–31 cells and 77–122 boutons for PFS, DFS and NFS cells. (B) Mean Δ[Ca2+]i values in response to single AP stimulation in each IN type at different exogenous buffering levels. (C) Mean Δ[Ca2+] values in response to five APs at 60 Hz, using n = 3–9 cells and 18–24 boutons for PFS, DFS and NFS cells. (D) Dynamics of five‐AP‐evoked Ca2+ transients in cells loaded with OGB‐6F (112 μm), expressed as Δ[Ca2+], calculated in different cell types. Dunn's post‐hoc test after Kruskal–Wallis test, except DFS vs. PFS comparison at 56 μm OGB‐1, where two‐sample t‐test was used; *P < 0.05, **P < 0.01 and ***P < 0.001.
