
Figure 3.
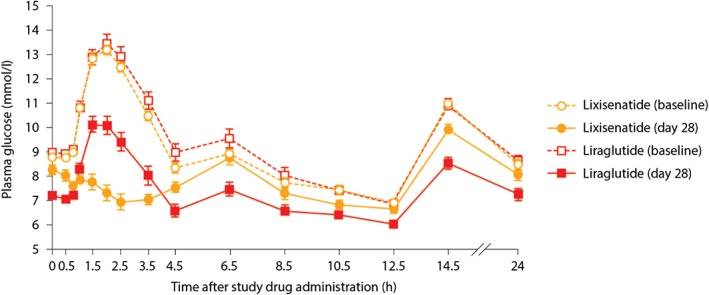
Mean 24‐h postprandial plasma glucose profiles at baseline and day 28. Data are mean ± standard error of the mean. Adapted from Kapitza et al. 61.
Official websites use .gov
A
.gov website belongs to an official
government organization in the United States.
Secure .gov websites use HTTPS
A lock (
) or https:// means you've safely
connected to the .gov website. Share sensitive
information only on official, secure websites.
Mean 24‐h postprandial plasma glucose profiles at baseline and day 28. Data are mean ± standard error of the mean. Adapted from Kapitza et al. 61.