
Figure 4.
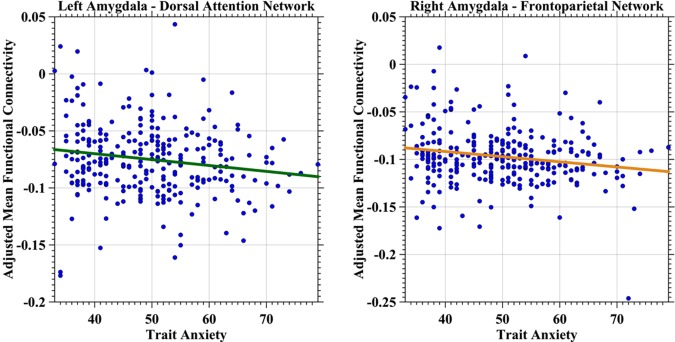
Scatter plots depict associations between trait anxiety and amygdala iFC with dorsal attention and frontoparietal networks. The network‐specific mean iFC of the amygdala was estimated as the averaged iFC value across the specific network and was further adjusted for global mean iFC, age, head motion, and registration quality by a regression model. The adjusted mean iFC values were plotted as blue scatter circles against the trait anxiety measures. The fitted lines were estimated and plotted as lines for both dorsal attention network (left panel) and frontoparietal network (right panel) with the colors of the same networks. [Color figure can be viewed in the online issue, which is available at http://wileyonlinelibrary.com.]