
Figure 5.
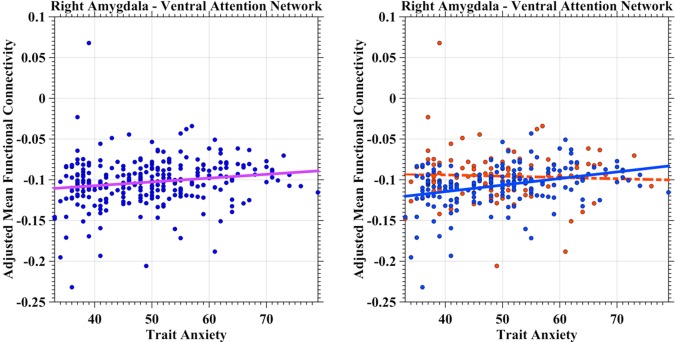
Scatter plots depict associations between trait anxiety and amygdala iFC with ventral attention network. The adjusted mean iFC values were plotted as blue scatter circles against the anxiety measures. The fitted lines were estimated and plotted as lines with the same color of the network in Figure 1 (left panel). The gender–anxiety interaction was illustrated in the right panel, indicating a significant positive correlation in females (blue circles and line) while no significant correlation in males (red circles and line). [Color figure can be viewed in the online issue, which is available at http://wileyonlinelibrary.com.]