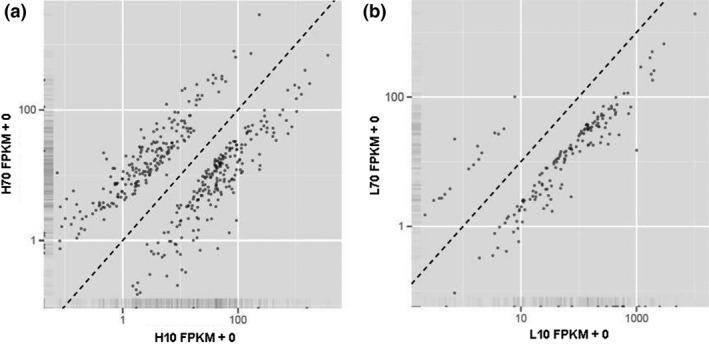
Figure 2.

Differential expression of genes between the early (days in milk = 10) and peak (days in milk = 70) stage of lactation. FPKM values under (above) the dotted line represent higher expression at the early (peak) stage of lactation. (a) H10 vs. H70; (b) L10 vs. L70.
