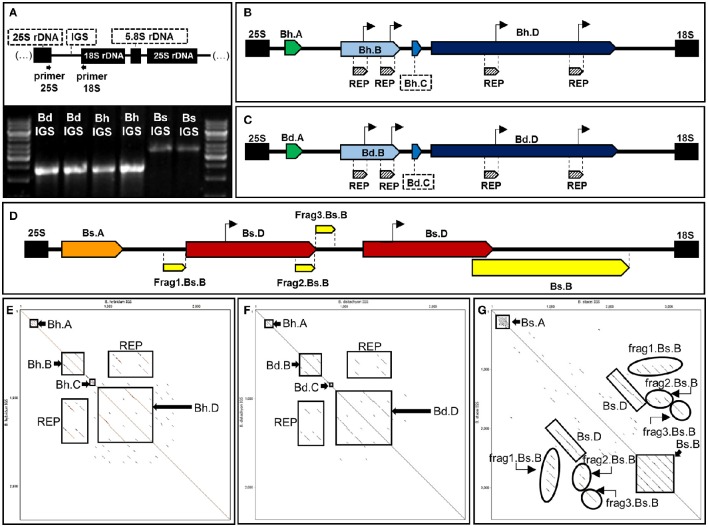
Figure 2.
Structural organization of 35S rDNA intergenic spacers of B. hybridum (Bh IGS) and the modern relatives of ancestral species B. distachyon (Bd IGS) and B. stacei (Bs IGS). (A) PCR profiles of the intergenic spacers. The position of primers that were used for PCR is indicated below the diagram of the 18S-5.8S-25S rDNA unit. Bright bands in the marker line reflect 6 kb (upper band) and 3 kb (lower band). (B,C) Schematic representation of Bh IGS (B), Bd IGS (C) and Bs IGS (D). Repetitive sequences in each intergenic spacer are denoted as pentagons with different colors. Putative transcription initiation sites (TISs) are marked as arrows over the diagrams. (E–G) Dot matrix plots of the intergenic spacers. Self-comparisons of Bh IGS (E), Bd IGS (F), and Bs IGS (G). Position of the repetitive sequences is indicated by rectangles.

