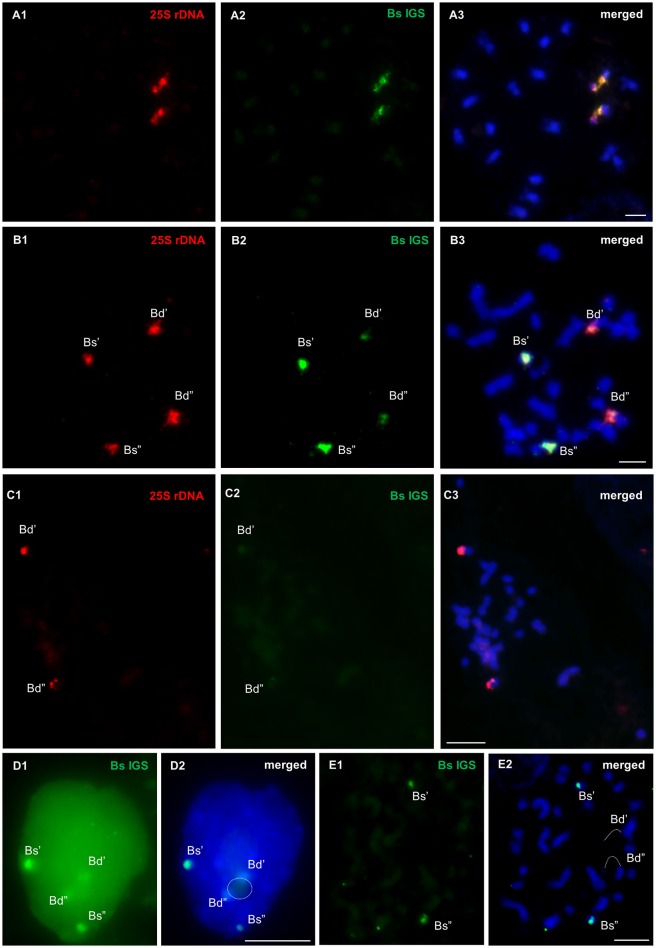
Figure 6.
FISH mapping of B. stacei IGS (green) and 25S rDNA (red) probes in the metaphase chromosome complements of B. stacei (A1–A3) and B. hybridum ABR113 (B1–B3, E1,E2) and ABR117 (C1–C3) as well as in the interphase nuclei that were isolated from B. hybridum roots (D1,D2). Stringency of the FISH experiments: 70% (A1–A3, B1–B3, C1–C3, D1,D2) or 87% (E1,E2). Chromatin stained with DAPI. Bars: 5 μm.

