
Figure 2.
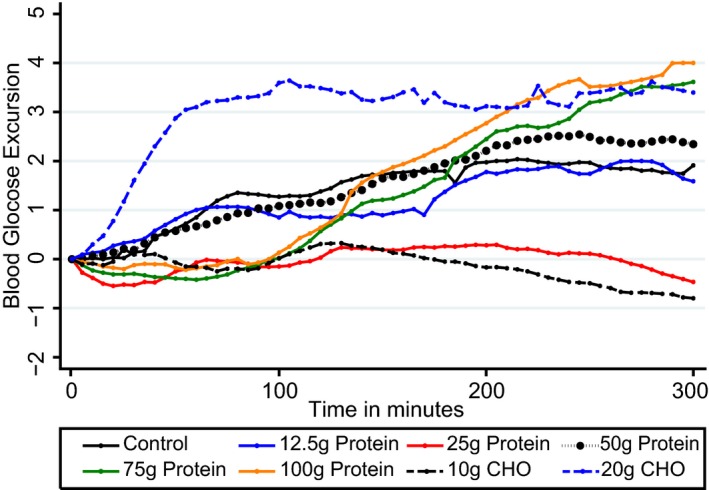
Mean postprandial glycaemic excursions for 27 participants following consumption of 8 test drinks containing 0, 12.5, 25, 50, 75 and 100 g of protein; with two glucose (CHO) test drinks given for comparison, in amounts of 10 and 20 g without insulin. Compared with 0, 75 and 100 g protein loads produced significantly higher glycaemic excursions from 180‐240 min (P = 0.002) and 240–300 min (P < 0.001). Glucose levels from 75 and 100 g protein were similar to that of 20 g CHO given without insulin however the shape of the response was different. CHO, carbohydrate.